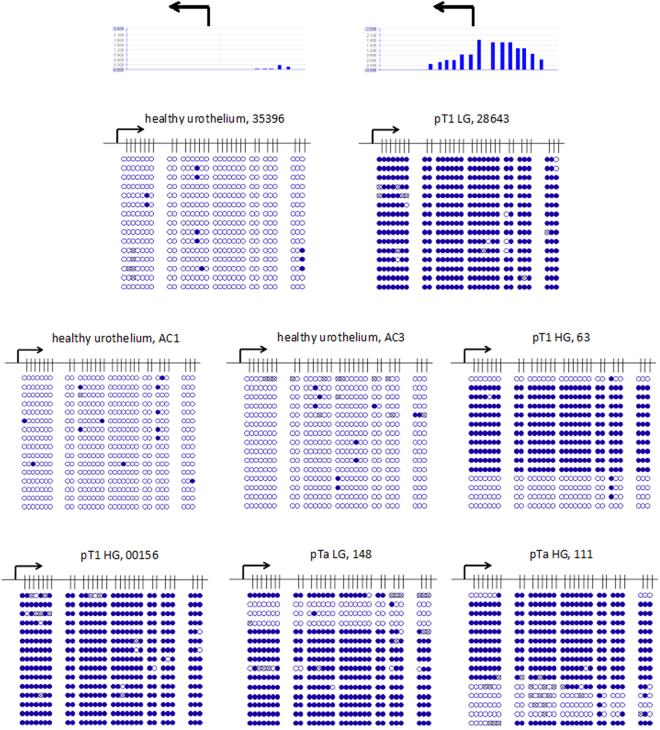
Figure 2.
Detailed analyses by bisulfite sequencing of CpG island methylation patterns within 5′ regulatory region of ODC1 gene in early urothelium carcinoma. Stage and grade of UC tissue specimens with sample IDs (Table 1) are depicted above the panels. Exemplified above the first two panels, two corresponding array results are shown by bar plots. Each blue bar represents a 75 bp long CpG rich probe on the array. The high of a bar is proportional to methylation degree. Below the detailed CpG methylation profiles of the ODC1 5′-regulatory region are documented as revealed by bisulfite sequencing. Filled circles stand for methylated CpG dinucleotides. White cyrcles stand for unmethylated CpGs. Crossed cyrcles stand for undefined CpG methylation status. Arrows indicate the transcription start site of ODC1 gene.

