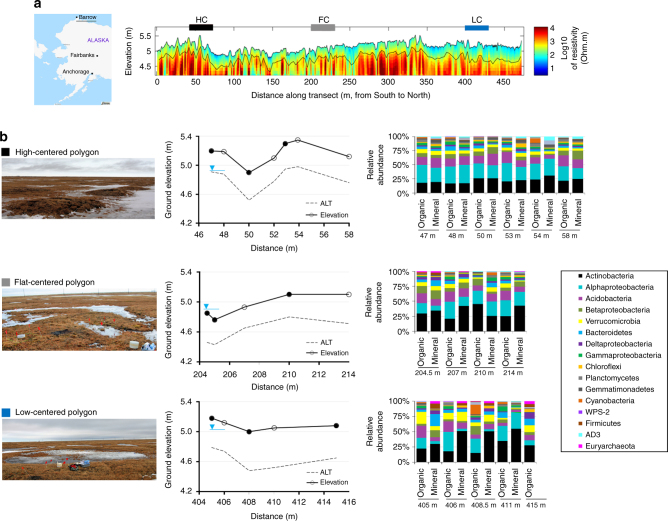
Fig. 1.
Microbial communities of active layer are strongly correlated to landscape topography in arctic polygonal tundra. Samples were collected from active layer soils and permafrost layer along a transect of high- (black), flat- (gray) and low- (blue) centered polygons located at Barrow Experimental Observatory. Map is adapted from ©OpenStreetMap contributors, licensed CC-BY-SA. a Electrical resistivity tomographic (ERT) data were, collected along the ~480 m transect, coincident with soil core retrieval and many different types of in situ soil measurements. ERT data were used to characterize deeper permafrost variability and ice-wedge structures (deeper yellow-red-blue), as well as active layer variability (blue-green). Along this ERT transect, the first 0–150 m were dominated by HC polygons (black bar) which transitioned to FC (gray bar) and LC (blue bar) polygons afterwards. ERT and soil characterization data are described elsewhere1. b Photographs (taken by the authors) show the differences in surface soil morphology among different polygon types. In HC polygons centers and troughs could have an elevation difference up to 0.6 m whereas elevation difference among rims, troughs, and centers of FC and LC polygons vary between 0.1–0.3 m. We collected samples for sequencing of the microbial community composition along the polygonal transect (circles show the sampling locations). Active layer thickness (ALT) was also measured at each sampling point. Water table (blue upside down triangle) levels are inferred from measured water levels in troughs and soil moisture measurements and show an estimated depth. CO2 and CH4 fluxes were measured in two consecutive years, 2012 and 2013 from rims, troughs, and centers of polygons (closed circles; Supplementary Fig. 9 and Supplementary Fig. 10)

