Fig. 6.
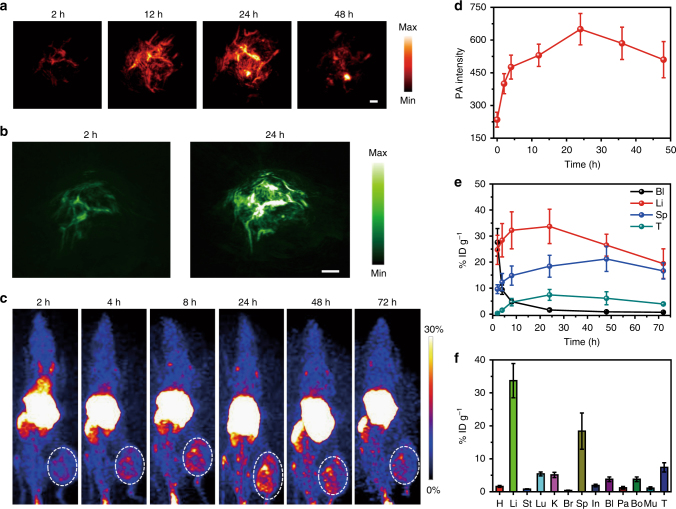
In vivo PA and PET imaging. a Representative PA maximum imaging projection (MIP) and b 3D images of tumour in a living mouse after systemic administration of SCNPs through i.v. injection. Scale bar is 2 mm. c Decay-corrected whole-body coronal PET images of HeLa tumour-bearing mice at 2, 4, 8, 24, 48, and 72 h after i.v. injection of 150 μCi of 64Cu SCNPs. d Quantification of PA intensities at 671 nm as a function of post-injection time of SCNPs (n = 3). e Time-activity curves quantified based on PET images (n = 3). f Biodistribution of the 64Cu SCNPs in mice bearing HeLa tumours at 24 h post-injection (n = 3). Data are expressed as means ± s.e.m

