Fig. 2.
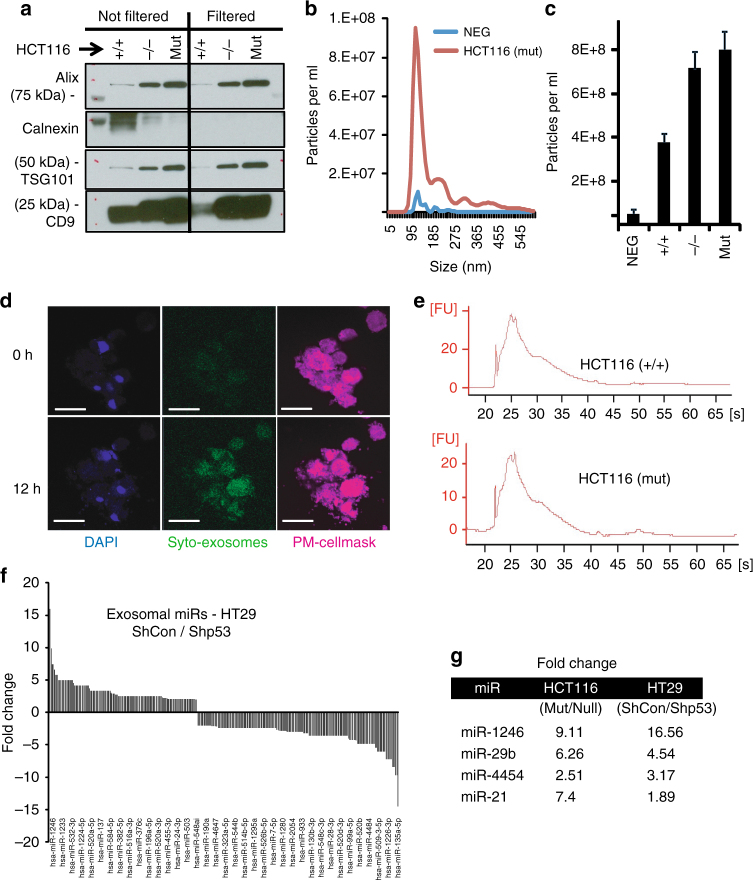
Exosomes shed from tumor cells are taken up by neighboring macrophages. a Exosomes were isolated from HCT116 cells harboring either WT, mutant (R248W), or no p53 as described in the Methods section. Isolations were either filtered (0.22 µm) or kept unfiltered during the procedure. Subsequently, isolations were lysed and subjected to western blot analysis with the indicated antibodies for exosomal markers. Calnexin served as a cellular contaminants marker. b,c Exosomes isolated from HCT116 cells underwent a nanoparticle tracking analysis (NTA) to determine exosomal size distribution (b) and concentration (c). The exosome samples were compared with cell-free medium that underwent similar isolation procedure (NEG). d Exosomes isolated from HCT116 cells were labeled using a Syto RNAselect dye before being incubated with macrophages for periods of 24 or 48 h. Accumulation of exosome uptake was captured in time-lapse movies. Macrophage nuclei are labeled with DAPI, plasma membranes are labeled with CellMask far-red. Bars = 25 µm. e RNA was extracted from HCT116-derived exosomes and its integrity and quality were tested using a bioanalyzer system before it was subjected to miRNA expression assay and normalized to the most abundant 100 miRs. f A representative comparison displaying greater than twofold changes in miRs between HT29 cells either knocked down for mutp53 (Shp53) or not (ShCon). g Changes in expression for four prominent miRs that were found to be significantly more abundant in mutp53 HCT116 and HT29 cells

