Figure 1.
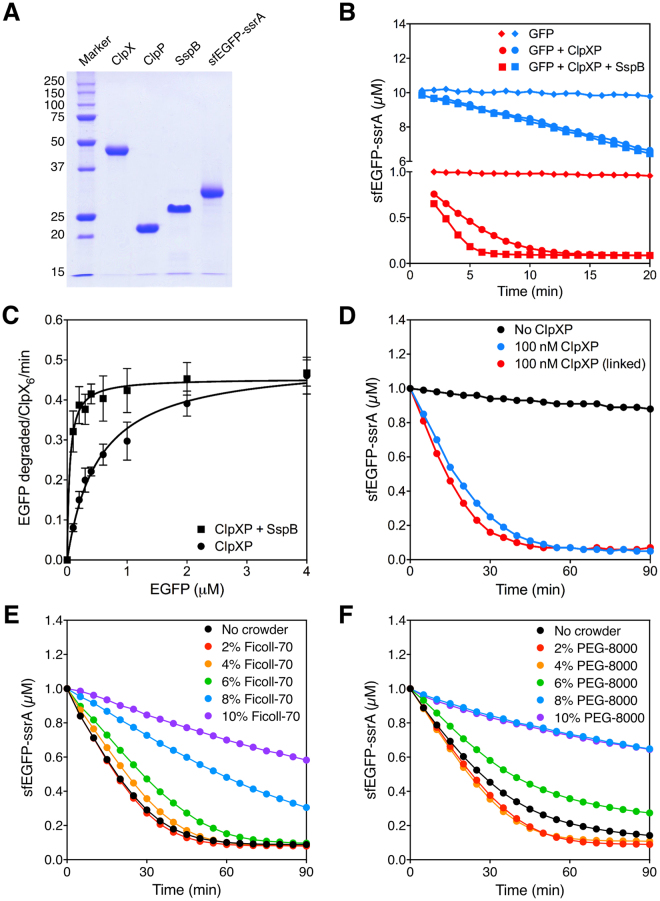
Degradation of sfEGFP-ssrA by ClpXP in buffer. (A) SDS-PAGE showing the purified E. coli ClpX, ClpP, SspB, and sfEGFP-ssrA proteins. (B) Degradation of sfEGFP-ssrA by ClpXP in the presence (squares) or in the absence (circles) of SspB performed in the PD buffer. The concentration of sfEGFP-ssrA was either 1 μM (red) or 10 μM (blue), and the concentration of ClpXP was 300 nM. No ClpXP was added to control reactions done in parallel (diamonds). (C) Measurement of steady-state kinetic parameters (kcat and KM). The initial rate of protein degradation per ClpXP molecule at different sfEGFP-ssrA concentration was used to determine the kinetic parameters. The kcat for ClpXP degradation of sfEGFP-ssrA is 0.46 ± 0.01 min−1 in the presence of SspB (square) and 0.50 ± 0.02 min−1 in the absence of SspB (circle). The KM is 0.04 ± 0.007 μM in the presence of SspB and 0.52 ± 0.05 μM in the absence of SspB. (D) Protein degradation by the wild type ClpX (blue) and the linked-hexameric version (red) of ClpX6. The degradation of 1 μM sfEGFP-ssrA by 100 nM of each version of ClpXP. No ClpXP was added to the control reaction done in parallel (black). (E) Crowding effect of Ficoll-70 on ClpXP degradation. 1 μM sfEGFP-ssrA were degraded by 100 nM ClpXP in the presence of 0 to 10% w/w of crowding agent. (F) Crowding effect of PEG-8000 on ClpXP degradation. 1 μM sfEGFP-ssrA were degraded by 100 nM ClpXP in the presence of 0 to 10% w/w of crowding agent. The error bars show the standard deviation from at least three independent experiments. Plots without error bars are representative of at least three repeated experiments.

