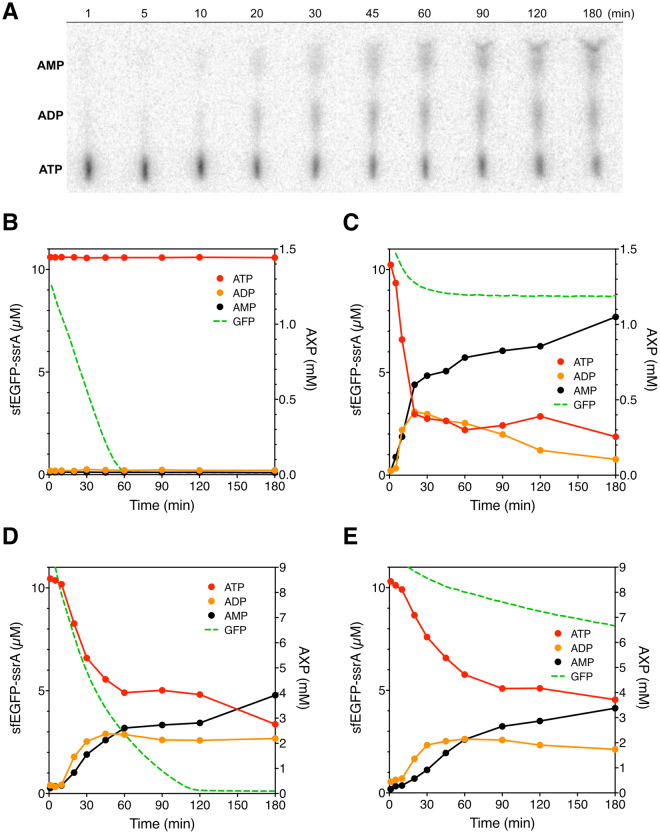
Figure 4.
ATP consumption and protein degradation by ClpXP. (A) A representative phosphor image of ATP consumption assay by ClpXP in the TX-TL system with additional 8 mM ATP, 16 mM phosphoenolpyruvate, and 16 U/mL pyruvate kinase. Samples were collected and quenched at 1, 5, 10, 20, 30, 45, 60, 90, 120, and 180 minutes after the reaction started. ATP, ADP, and AMP were separated on a PEI-cellulose TLC plate and quantified with a phosphor imager. The dark spots correspond to radioactive ATP, ADP, and AMP, respectively, from bottom to top. Spots were quantified and normalized by each lane and the ratio of each adenosine phosphate species were plotted. (B–E) are graphs showing protein degradation and ATP consumption. All reactions were performed with 300 nM ClpXP (except in (E)) and 10 µM sfEGFP-ssrA in different conditions for 3 hours. (B) The reaction was performed in premix 1. (C) The reaction was performed in the TX-TL system with premix 1. (D) The reaction was performed in the TX-TL system with premix 4. (E) The reaction was performed without ClpXP in the TX-TL system with premix 4. Data are representative of at least three repeated experiments.

