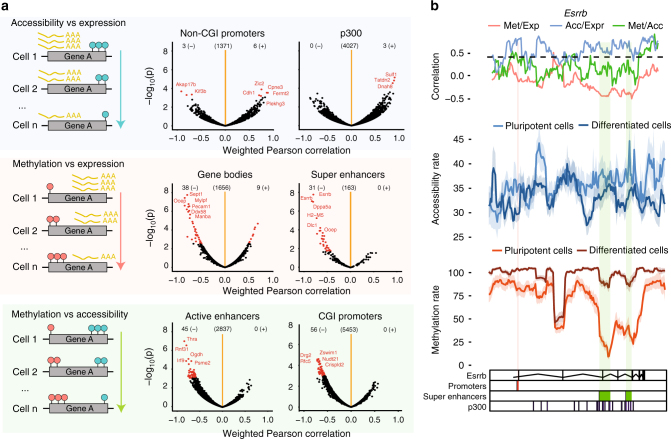
Fig. 3.
scNMT-seq enables the discovery of novel associations at individual loci. a Left panel shows an illustration for the correlation analysis across cells, which results in one association test per locus. The right panel shows the Pearson correlation coefficient (x-axis) and log10 p-value (y-axis) from association tests between different molecular layers at individual loci, stratified by genomic contexts. Significant associations (FDR <0.1, Benjamini–Hochberg adjusted), are highlighted in red. The number of significant positive (+) and negative (−) associations and the number of tests (centre) are indicated above. Sample size varies depending on the number of cells, which have coverage for a specific loci (see Methods). b Zoom-in view of the Esrrb gene locus. Shown from top to bottom are: Pairwise Pearson correlation coefficients between each pair of the three layers (Met methylation, Acc accessibility, Expr expression). Accessibility (blue) and methylation (red) profiles shown separately for pluripotent and differentiated sub-populations; mean rates (solid line) and standard deviation (shade) were calculated using a running window of 10 kb with a step size of 1000 bp; Track with genomic annotations, highlighting the position of regulatory elements: promoters, super enhancers, and p300 binding sites

