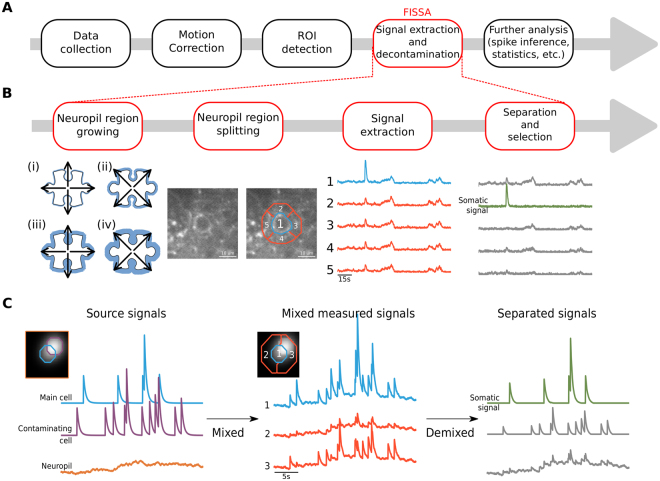
Figure 1.
FISSA toolbox overview. (A) Schematic of a generic calcium imaging data analysis workflow. (B) Schematic of the four main steps of the FISSA toolbox workflow. Given a predefined region of interest (ROI), the local neuropil region is defined by expanding the ROI (white shape) alternately in the cardinal and diagonal directions (steps i to iv), until the surrounding area (blue area) is four times the ROI area. The resulting neuropil region is split into four subregions (regions 2, 3, 4, and 5). The signals from each of these regions are separated using non-negative matrix factorization (NMF), and the somatic signal is identified. (C) Schematic representation of blind source separation in FISSA. Left: Model of a somatic signal (blue) contaminated by two types of sources: the surrounding neuropil (orange), and an overlapping soma (purple). Middle: The measured signals in the somatic ROI (region 1) and in the surrounding neuropil (regions 2 and 3) will each be a mix of the three underlying source signals shown in the left panel. Right: NMF separates the mixed signals, recovering the original source signals. From these demixed components the one that best matches the measured ROI signal, relative to the neuropil regions, is identified as the somatic signal.

