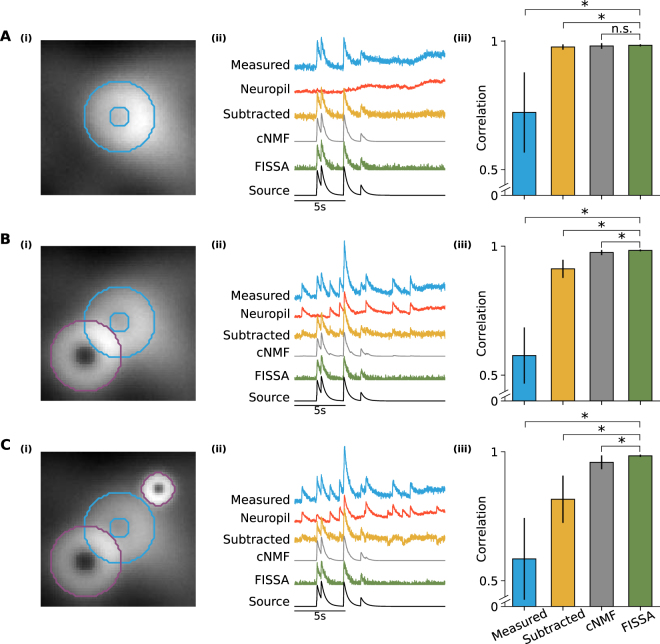
Figure 2.
Comparison of FISSA performance with other decontamination methods on simulated calcium imaging data. Rows A, B, and C illustrate three cases with increasing levels of contamination. (A)(i) Image of a region containing a single doughnut-shaped cell firing at 0.5 Hz and a fluctuating neuropil background. The image is an average across all 12000 frames (120 s). The ROI is indicated in blue. (ii) Example fluorescence traces for the blue ROI indicated in panel A(i): average measured signal of the ROI (blue trace, ‘Measured’), the average surrounding neuropil signal (red trace), and the signals after neuropil decontamination by three different methods (subtraction in yellow, cNMF in grey, and FISSA in green). The uncontaminated source signal (as defined by the simulation) is shown in black. The cNMF trace has a lower noise level as the cNMF algorithm also includes smoothing. (iii) Average Pearson correlations between the ROI source signal and the extracted ROI signal: before decontamination (first column, ‘Measured’, 0.723), and after each decontamination method (neuropil subtraction, cNMF, and FISSA; 0.977, 0.981, and 0.984 respectively). Error bars indicate standard deviation. *p < 0.05; **p < 0.005; n.s.: not significant (p > 0.05); Wilcoxon signed-rank test, n = 10 simulations of 120 s each (with different background neuropil signals, spike times, and photon noise). FISSA vs: measured p = 0.0033, subtraction p = 0.0409, cNMF p = 0.0911. (B) As panel A, but the blue ROI is additionally contaminated by an overlapping cell firing at 0.3 Hz (indicated by the purple outline). Average values for the four methods are 0.576, 0.912, 0.975, and 0.984 respectively. FISSA vs: measured p = 0.0033, subtraction p = 0.0033, cNMF p = 0.0033. (C) As panel B, but an additional bright localized signal firing at 0.3 Hz was added (smaller purple outline). Average values for the four methods are 0.585, 0.816, 0.959, and 0.984 respectively. FISSA vs: measured p = 0.0051, subtraction p = 0.0051, cNMF p = 0.0051.

