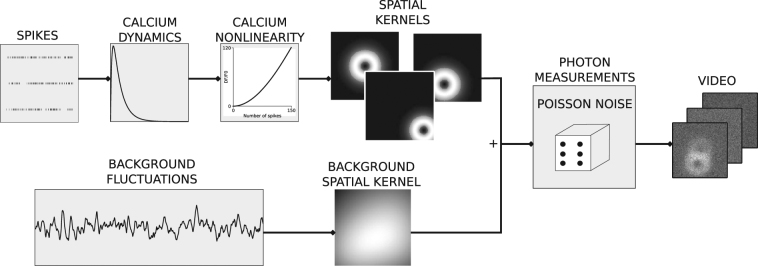
Figure 6.
Simulated data generation. For each simulated neuron, a Poisson spike train is generated. The corresponding calcium indicator dynamics are simulated using GCaMP6 rise and decay times, and a nonlinearity. Next, the calcium traces are associated with a spatial kernel consisting of a doughnut shape mask (that models the cellular soma’s structure) and a Gaussian that simulates signal spread. Additionally, noisy background fluctuations are generated which vary spatially through a spatial kernel. All resulting signals are summed, and passed through a Poisson generation process to simulate photon emission, resulting in the final image sequence.

