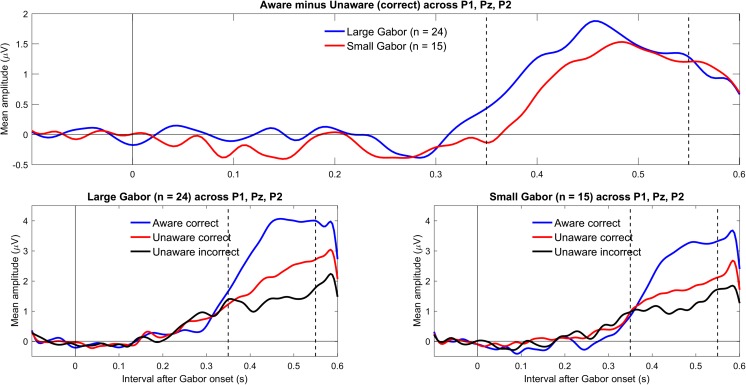
Fig. 4.
Grand mean ERPs for parietal electrodes (P1, Pz, and P2). The upper panel shows LP for large and small Gabors. The lower panels show ERPs for aware correct, unaware correct, and unaware incorrect trials for large Gabors (left) and small Gabors (right). In the plots, the data were low-pass filtered at 30 Hz. (Color figure online)

