
Fig. 5. Flow cytometric analysis of embryonic erythropoiesis.
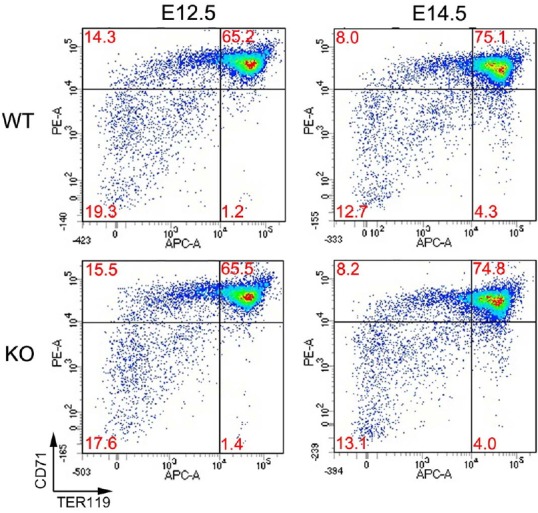
Cells were labelled with APC-conjugated anti-mouse TER119 and PE-conjugated CD71. Each quadrant represents distinct stages of development. Note the increase in proportions of relatively mature populations (CD71+ TER119+ and CD71− TER119+) in E14.5 cells compared to E12.5 cells. Note the lack of difference between wild type and homozygous mutant mice (E12.5, n = 6 & E14.5, n = 3).