
FIG 3.
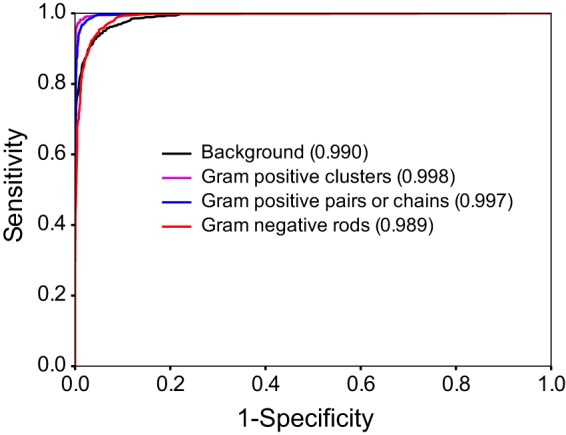
Receiver operating characteristic (ROC) curve. Curves were generated for each category by varying the threshold for positivity. Values corresponding to the area under the curve are indicated in parentheses.
Official websites use .gov
A
.gov website belongs to an official
government organization in the United States.
Secure .gov websites use HTTPS
A lock (
) or https:// means you've safely
connected to the .gov website. Share sensitive
information only on official, secure websites.
Receiver operating characteristic (ROC) curve. Curves were generated for each category by varying the threshold for positivity. Values corresponding to the area under the curve are indicated in parentheses.