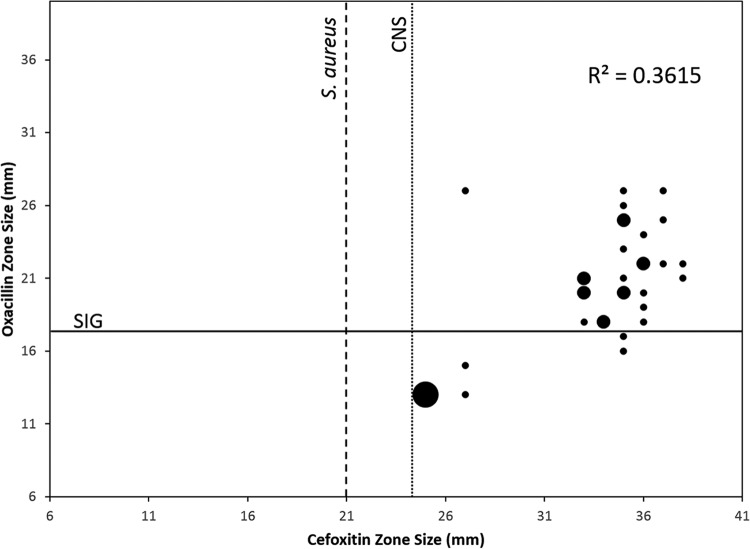
FIG 2.
Correlation of oxacillin and cefoxitin zone sizes (in millimeters) for a subset of SIG isolates (n = 34) tested by both cefoxitin and oxacillin disk diffusion. The lines represent susceptibility breakpoints for coagulase-negative Staphylococcus (CNS, dotted line), S. aureus (dashed line), and SIG (solid line), as described in CLSI standards (17). Seven MR isolates were mischaracterized as methicillin susceptible by cefoxitin (lower right section of graph). Small points indicate 1 isolate, medium-sized points represent 2 isolates, and the largest point represents 3 isolates.

