FIG 3.

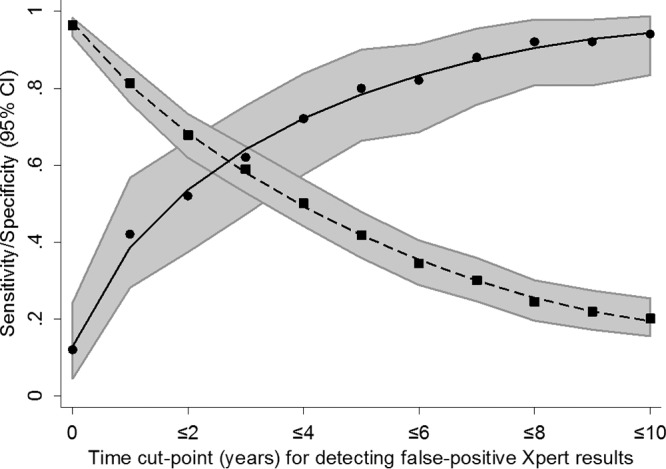
Suboptimal sensitivity (squares, dashed line) and specificity (circles, solid line) of different cutoff points (years) for classifying patients with previous TB as likely to be false or true positive with Xpert.

Suboptimal sensitivity (squares, dashed line) and specificity (circles, solid line) of different cutoff points (years) for classifying patients with previous TB as likely to be false or true positive with Xpert.