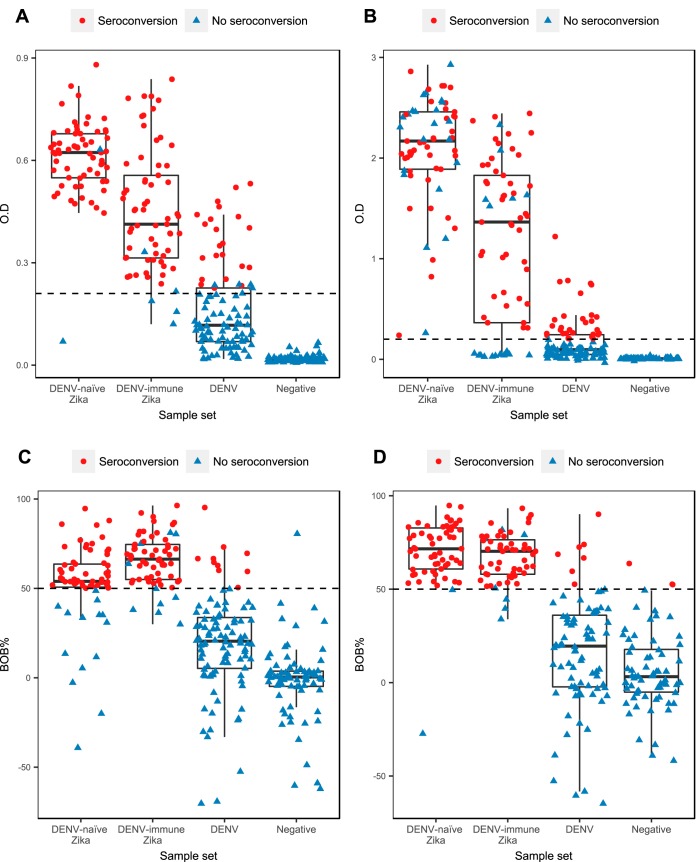
FIG 1.
Box-and-whisker plots graphing results from convalescent-phase samples obtained using each serological method, stratified by sample set. (A) CNDR MAC-ELISA, early-convalescent-phase samples. (B) NIAID-BEI MAC-ELISA, early-convalescent-phase samples. (C) ZIKV NS1 BOB ELISA, early-convalescent-phase samples. (D) ZIKV NS1 BOB ELISA, late-convalescent-phase samples. Red dots represent results from convalescent-phase samples that underwent seroconversion from the acute to convalescent phase in paired samples. Blue triangles represent results from convalescent-phase samples that did not undergo seroconversion. The dotted horizontal lines indicate the cutoff values for each method. For the CNDR MAC-ELISA, the mean cutoff value is depicted, while the other methods have a fixed cutoff value.

