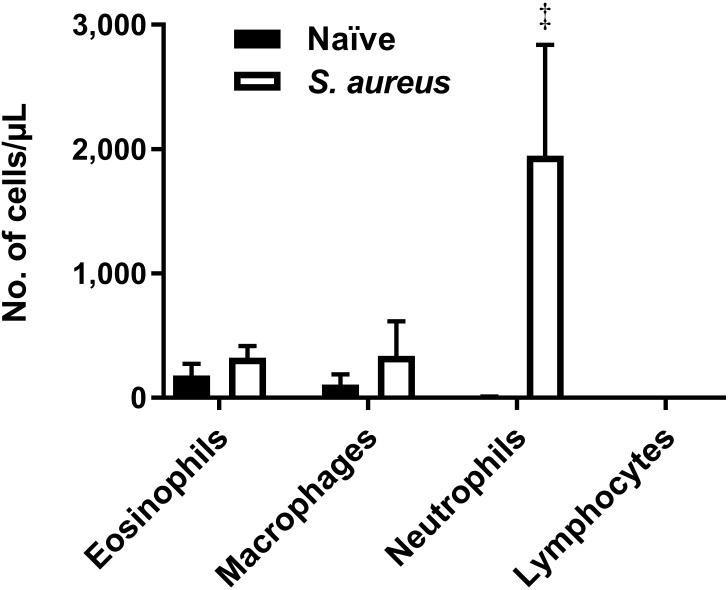
Figure 6.
Infection with S. aureus induces a neutrophilic response. Comparison of BAL cytology between naïve cotton rats and those infected with 4 × 10⁷ cfu of S. aureus. BAL fluid was collected 24 h after infection. Bars represent mean values (n = 4–8 per group); error bars, 1 SD. Values differ significantly (‡, adjusted P < 0.001; Welch t tests, Holm–Sidak correction) from that for naïve cotton rats.

