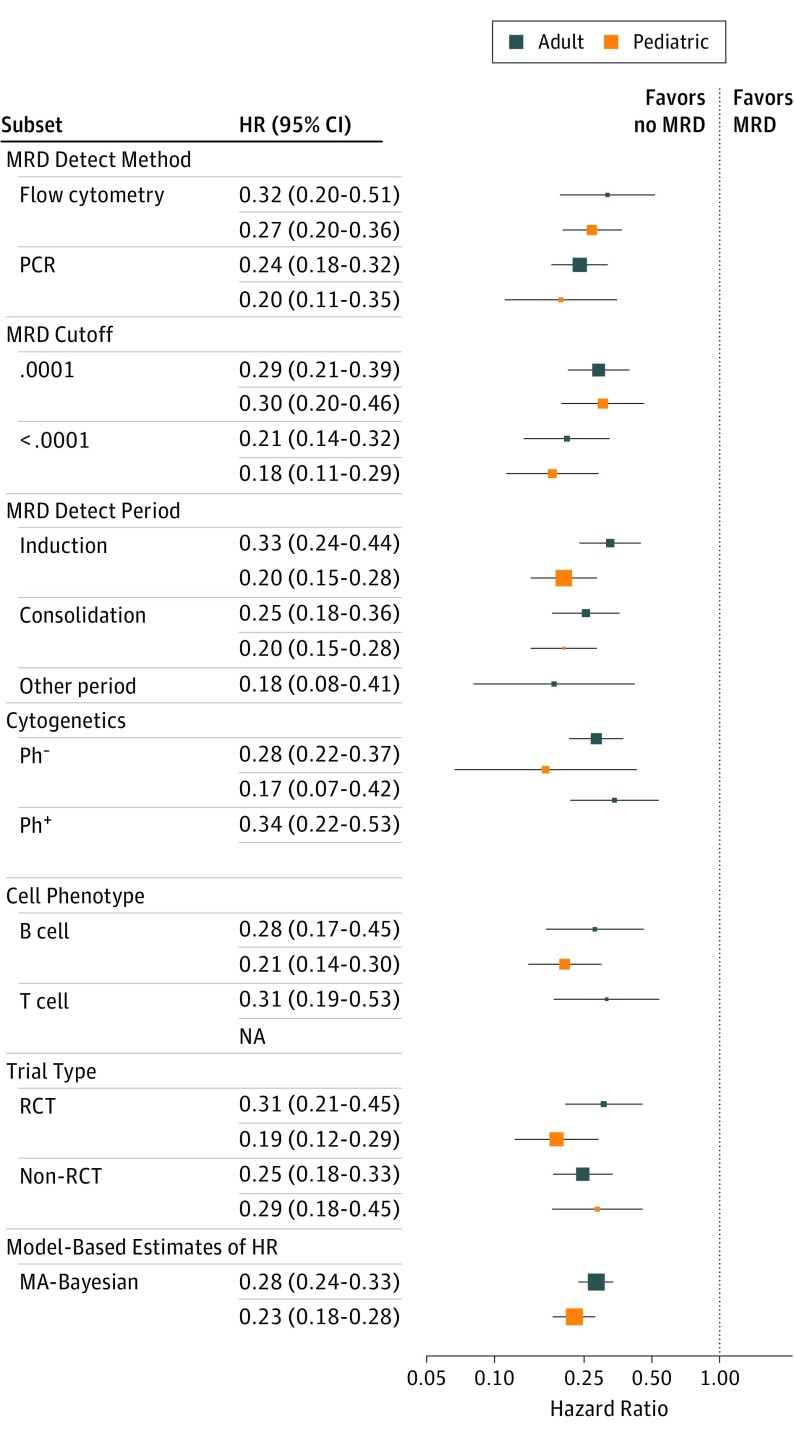
Figure 3. Forest Plot of EFS HRs for Pediatric and Adult ALL Subtypes.
Numerical results are in eTable 2 in the Supplement. The dots represent the mean HR for the Bayesian hierarchical analysis. The horizontal lines show the 95% BCIs for the subgroup’s EFS HR. ALL indicates acute lymphoblastic leukemia; EFS, event-free survival; OS, overall survival.

