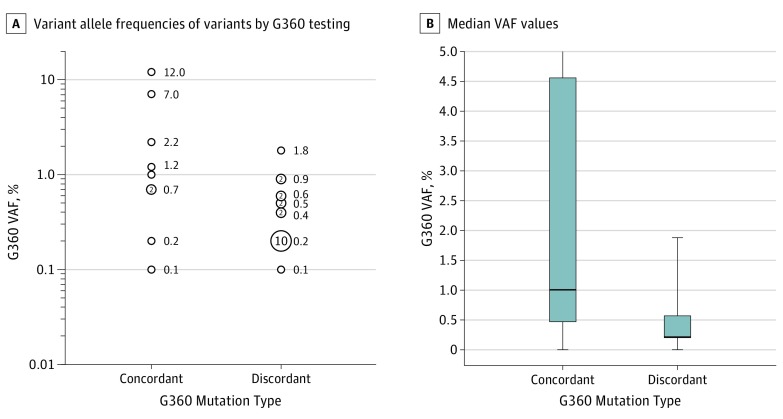
Figure. Association Between Variant Allele Frequencies (VAFs) of Variants Identified by G360 and Concordance With F1 Testing.
A, Distributions of VAFs for variants identified by G360 testing that are concordant (n = 10) or discordant (n = 22) with F1 results. Numbers of mutations are depicted by the size of the circles. Circles without numbers denote single mutations. Among variants identified by G360, discordance with F1 results is significantly more likely at VAFs of less than 1% (P = .005; Fisher exact test, 2-sided). When limiting variants identified by G360 to those with VAFs of 1% or more, 5 of 10 concordant mutations remain, whereas only 1 of the 22 discordant mutations remain. For 3 G360 mutations, VAFs were not provided in patient reports for 3 mutations and are, therefore, not displayed; of these, 2 mutations were discordant and 1 mutation was concordant with F1 results. B, Box plots display the median VAFs (black horizontal lines indicate the 50th percentile), interquartile range (box plots indicate the 25th-75th percentile), and minimum and maximum VAF values (whiskers). The maximum VAF for concordant mutations fell outside the displayed range, at 12%. Discordant mutations have a significantly lower median VAF relative to concordant mutations (P = .02; Mann-Whitney test for a nonparametric comparison). Median VAFs for concordant and discordant G360 mutations are 1.0% and 0.2%, respectively. Mean VAFs for concordant and discordant G360 mutations are 2.8% and 0.4%, respectively.

