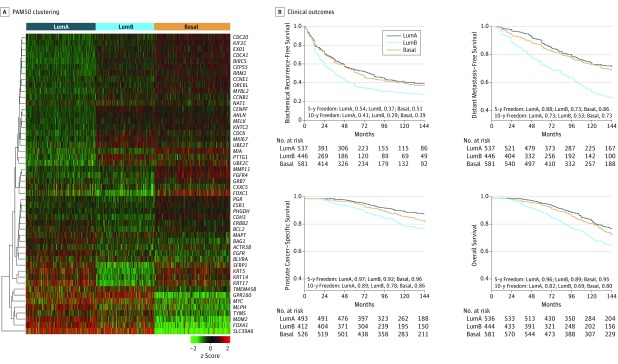
Figure 1. PAM50 Clustering and Clinical Outcomes in Prostate Cancer.
A, The PAM50 genes cluster prostate cancer samples into 3 subtypes, luminal A (LumA), luminal B (LumB), and basal, in the pooled prostate cancer cohorts (Mayo Clinic I and II, Cleveland Clinic, Thomas Jefferson University, Johns Hopkins University, and Durham Veterans Affairs) using hierarchical clustering of the genes. Each column represents a patient sample, and each row represents a gene. B, Kaplan-Meier curves showing that the PAM50 clusters risk stratify biochemical recurrence-free survival, distant metastasis–free survival, prostate cancer–specific survival, and overall survival.

