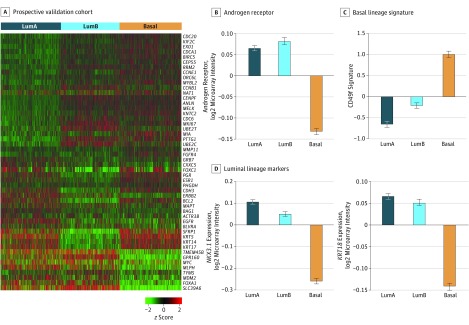
Figure 3. Prospective Validation in GRID.
A, PAM50 clusters demonstrate the same pattern of expression in a prospective validation cohort of 2215 prostate cancer samples run on a commercial clinical platform, with 3 subtypes: luminal A (LumA), luminal B (LumB), and basal. B, As in the retrospective cohorts, AR is increased in luminal samples (P < .001). C, The basal lineage CD49f signature is increased in the basal subtype (P < .001). D, NKX3-1 (P < .001) and KRT18 (P < .001) are increased in the luminal subtypes. Bar graphs show the mean (SE) of median-centered gene expression, and P values are determined via analyses of variance.

