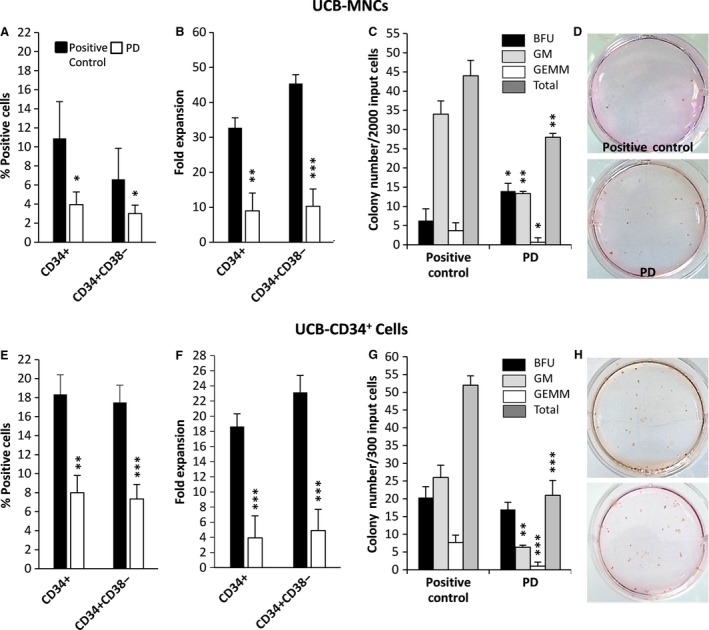
Figure 2.

(A) The percentage of CD34+ and CD34+ CD38− cells in UCB‐MNCs and (E) UCB‐CD34+ cells, expanded for 10 days by cytokines in the presence or absence of PD. (B) The fold expansion of CD34+ and CD34+ CD38− cells in UCB‐MNCs and (F) UCB‐CD34+ cells expanded for 10 days by cytokines in the presence or absence of PD. Fold expansion was determined by dividing the total number of viable cells expressing the phenotype at the end of the culture by the input number of viable cells expressing the same phenotype (n = 3). Classification and number of colony‐forming units (CFUs) in (C) 2000 progeny of UCB‐MNCs and (G) 300 progeny of UCB‐CD34+ cells expanded for 10 days by cytokines in the presence or absence of PD, summarized from three separate samples (n = 6), statistically significant difference compared with positive control group, *P ≤ 0.05, **P ≤ 0.01, ***P ≤ 0.001. (D, H) Photomicrograph of colonies developed in six‐well plates.
