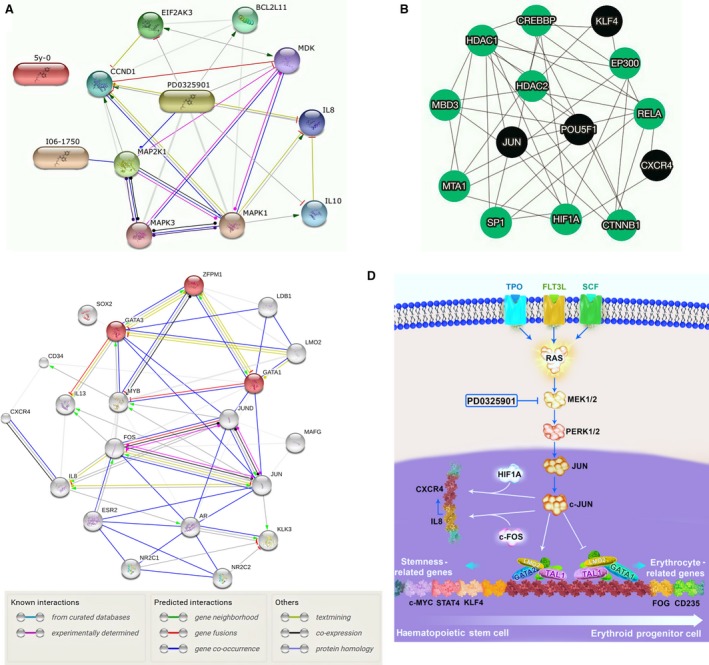
Figure 6.

(A) String pathway to show the node of PD effects. (B, C) Visualization of protein–protein interaction using selected transcription factors in the present study and those which contribute in erythropoiesis. (D) Schematic illustration of PD effects on maintenance, differentiation and homing of HSCs.
