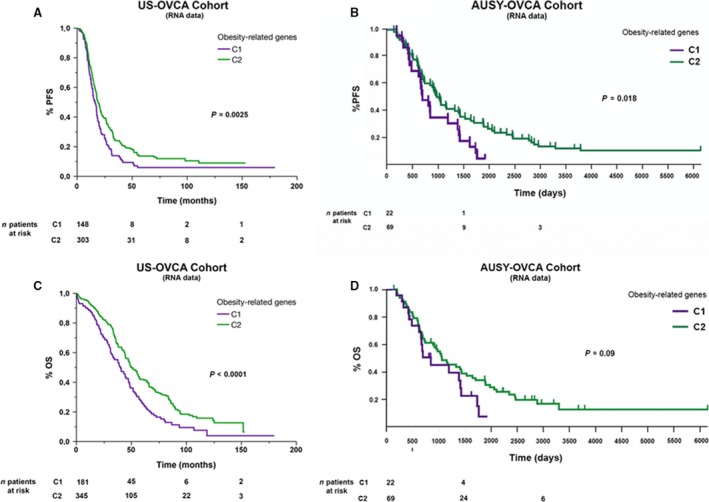
Figure 2.

Comparative analysis of progression‐free survival (PFS) and overall survival (OS) of two clusters (named as C1 and C2) obtained after NMF clustering of RNA expression microarray data of obesity and lipid metabolism‐related genes of HGOSCs from the two cohorts.
