Figure 3.

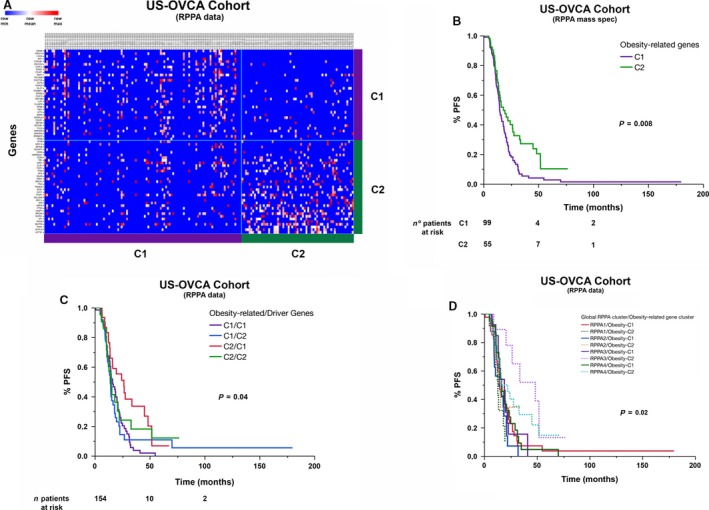
Heat map view and survival analyses of two clusters obtained after NMF analysis using RPPA expression (microarray and mass spectrometry) data of obesity and lipid metabolism‐related and cancer driver genes. (A) Heat map view of clusters obtained after NMF analysis of RPPA data of obesity and lipid metabolism‐related genes. (B) Comparative analysis of PFS between these two clusters, including only TP53 mutant samples. (C) Stratification of PFS curves after overlapping clusters obtained by NMF analysis of obesity/metabolism‐related gene RPPA expression on top of clusters obtained by NMF analysis of cancer driver genes in HGOSCs. (D) Stratification of PFS curves after overlapping clusters obtained by NMF analysis of obesity/metabolism‐related gene RPPA expression on top of clusters obtained by best NMF clustering of global RPPA expression data in HGOSCs.
