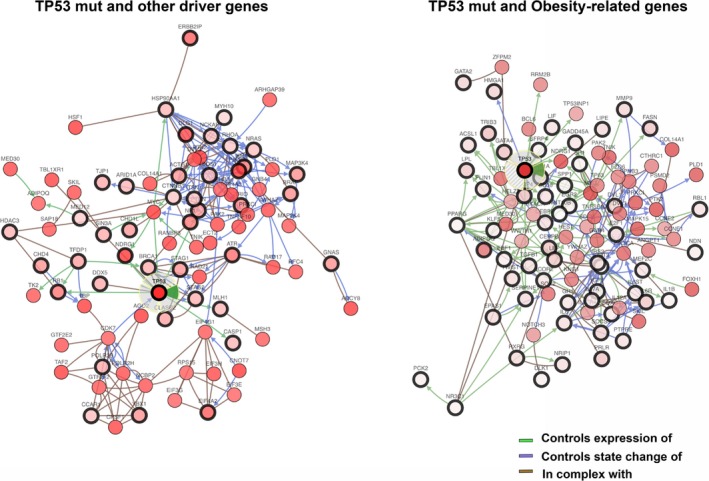
Figure 5.

Graphical representation of network analysis and main biological interactions of cancer driver and obesity/metabolism‐related genes in relation to TP53 mutant in HGOSCs. Circles with wider black lines indicate the query genes, and those delimited by thin black lines highlight the more altered neighbour genes.
