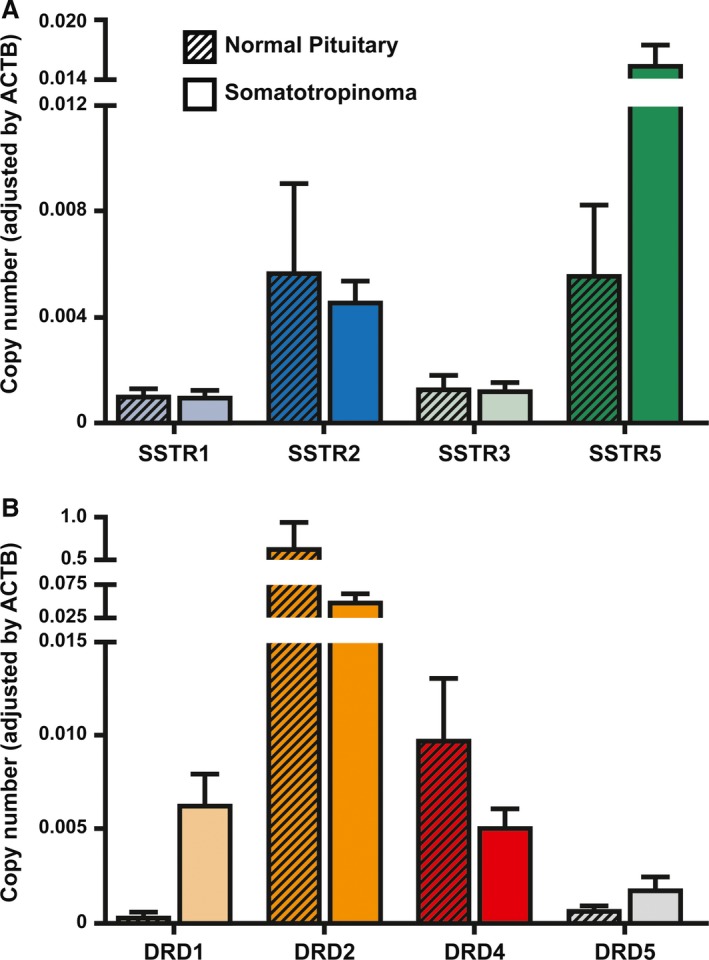
Figure 1.

SSTR and DRD expression in normal pituitary and GH‐producing pituitary adenomas. (A) Expression profile of SSTR in normal human pituitary (n = 10) and human somatotropinomas (n = 74). (B) Expression profile of DRD in normal human pituitary (n = 10) and human somatotropinomas (n = 74). mRNA expression levels were measured by quantitative RT‐PCR. Copy numbers of each transcript were adjusted by the expression levels of a control gene (ACTB). Data are shown as mean±S.E.M.
