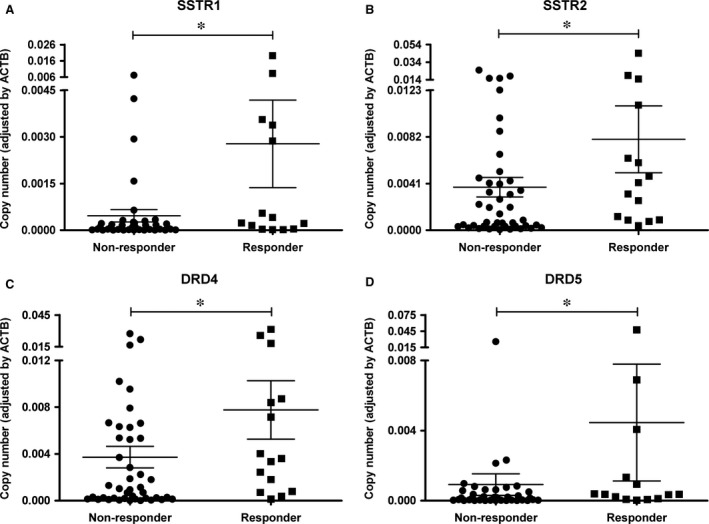
Figure 2.

Increased SSTR and DRD expression in adenomas from patients responsive to 3 months SSAs treatment. (A) SSTR1 mRNA copy numbers. (B) SSTR2 mRNA copy numbers (P = 0.06). (C) DRD4 mRNA copy numbers. (D). DRD5 mRNA copy numbers. Responder is defined as an IGF‐1 per cent reduction higher than 50% upon SSAs treatment. Data points represent the copy numbers of each transcript adjusted by the expression levels of a control gene (ACTB) for each individual tumour. Mean and S.E.M. are also displayed. *FDR adjusted P value <0.05
