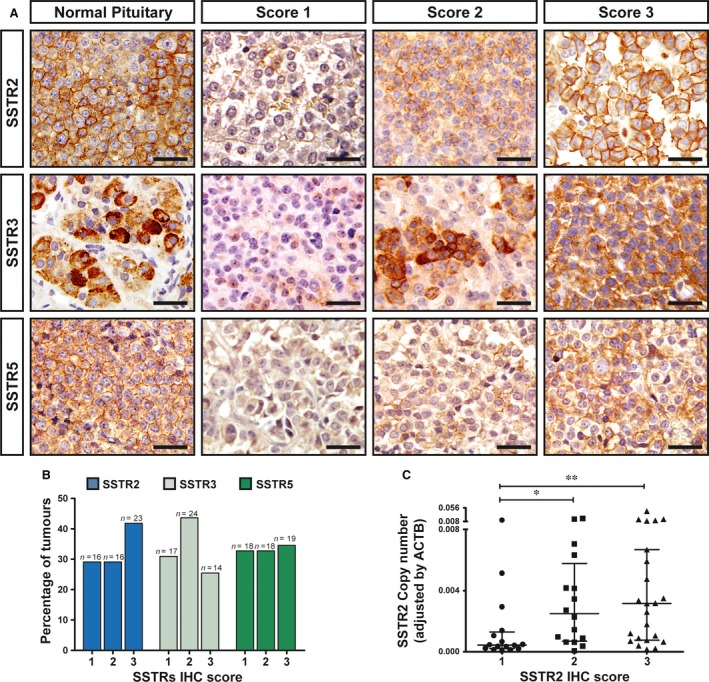
Figure 3.

Immunohistochemical detection of SSTR in somatotropinomas. (A) Representative images of SSTR2, SSTR3 and SSTR5 immunohistochemical scores in normal human pituitary (left column) and somatotropinomas. Examples of IHC scores for each SSTR in tumours are shown. Score 1, no or only cytoplasmic immunoreactivity; score 2, membranous immunoreactivity in less that 50% of cells; score 3, membranous immunoreactivity in more than 50% of cells. Scale bar: 50 μm. (B) Percentage of somatotropinomas for each IHC score (SSTR2, SSTR3 and SSTR5). (C) Comparison between SSTR2 mRNA and protein expression. SSTR2 copy number was significantly lower in the score 1 than in the scores 2 and 3. No difference between SSTR2 IHC scores 2 and 3 was observed. Data points represent the copy numbers of each transcript adjusted by the expression levels of a control gene (ACTB) for each individual tumour. Mean and S.E.M. are also displayed. The Kruskal–Wallis test was used for comparison among the three scores and the Mann–Whitney test for post hoc comparisons. *P < 0.05; **P < 0.01.
