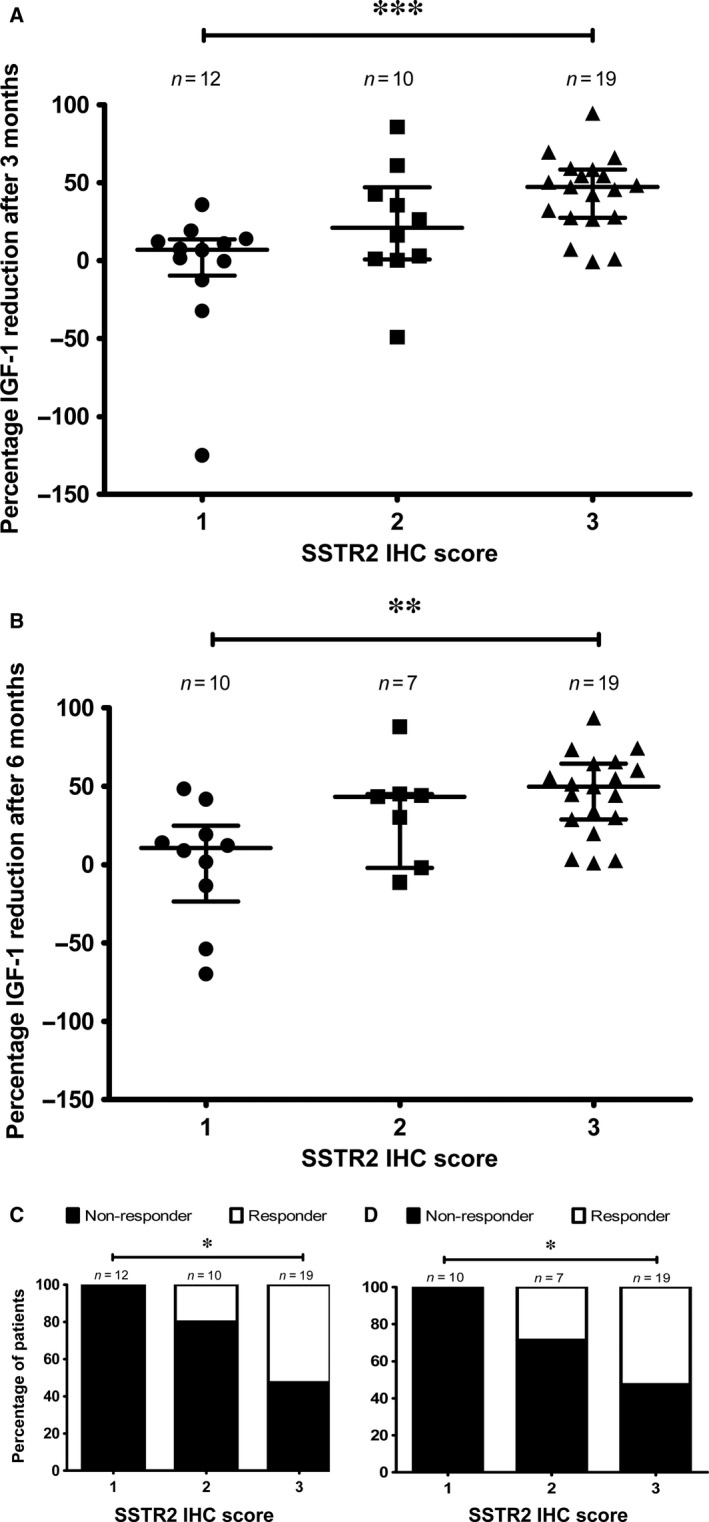
Figure 4.

IGF‐1 per cent reduction after SSAs treatment and SSTR2 score. (A) Comparison of IGF‐1 per cent reduction after 3 months of SSAs treatment with the different SSTR2 IHC scores. (B) Comparison of IGF‐1 per cent reduction after 6 months of SSAs treatment with the different SSTR2 IHC scores. Data points represent values for each individual patient. Mean and S.E.M. are also displayed. The Kruskal–Wallis test was used for comparison among the three scores and the Mann–Whitney test for post hoc comparisons. (C) Percentage of patients responsive to SSAs treatment after 3 months compared to SSTR2 IHC score. Chi‐square test was used. (D) Percentage of patients responsive to SSAs treatment after 6 months compared to SSTR2 IHC score. The Chi‐square test was used. *P < 0.05; **P < 0.01; ***P < 0.001.
