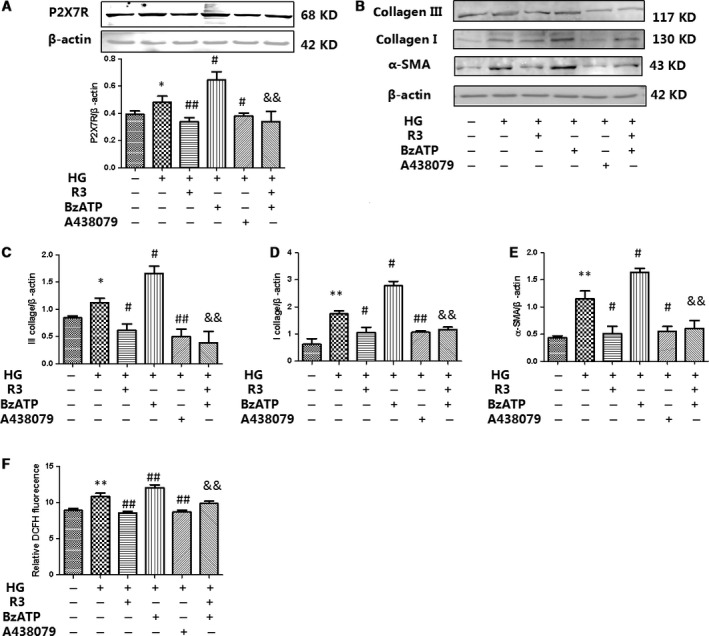
Figure 5.

H3 relaxin inhibited the collagen synthesis via P2X7R activation. (A) P2X7R protein expressions were analysed by Western blot. (B) Collagen I, collagen III and a‐SMA protein expressions were analysed by Western blot. (C) The protein levels of collagen III were normalized to β‐actin (collagen III/β‐actin). (D) The protein levels of collagen I were normalized to β‐actin (collagen I/β‐actin). (E) The protein levels of a‐SMA were normalized to β‐actin (a‐SMA/β‐actin).(F) ROS levels in cardiac fibroblasts were analysed by DCFH. Data are the means ± S.D., and each measurement carried out six times. *P < 0.05 versus control, **P < 0.01 versus control, # P < 0.05 versus HG, ## P < 0.01 versus HG, & P < 0.05 versus HG+BzATP, && P < 0.01 versus HG+BzATP.
