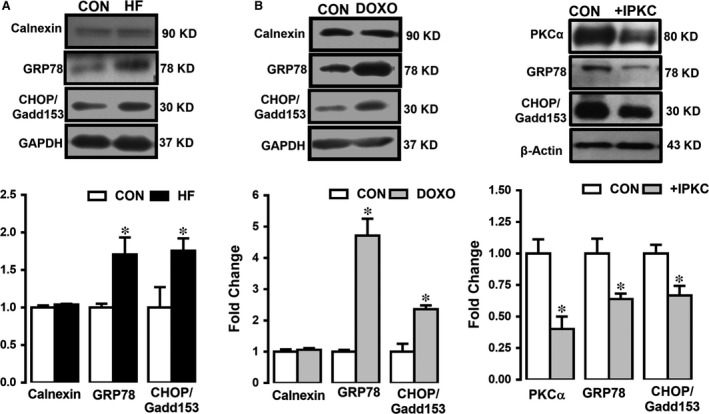
Figure 4.

Western blot analysis showing the expression levels of ER stress/chaperone proteins in human and doxorubicin‐treated H9c2 cells. The densitometry analysis showing the protein levels of GRP78, CHOP/Gadd153 and calnexin at 94 kD, 30 kD and 90 kD, respectively, as well as PKCα activation status detected as protein expression level at 80 kD (with respect to GAPDH at 37 kD) in human heart failure (HF) (A) and in doxorubicin (DOXO)‐treated H9c2 cells (B) with respect to their controls (CON group). Representative Western blotting bands for protein expression levels are given upper parts of figures in (A) and (B). Bars represent mean (±SEM) for each group. Number of human samples, n = 3 for HF and n = 2 for CON. Significance level accepted at *P < 0.05 versus CON and # P < 0.05 versus TUDCA group.
