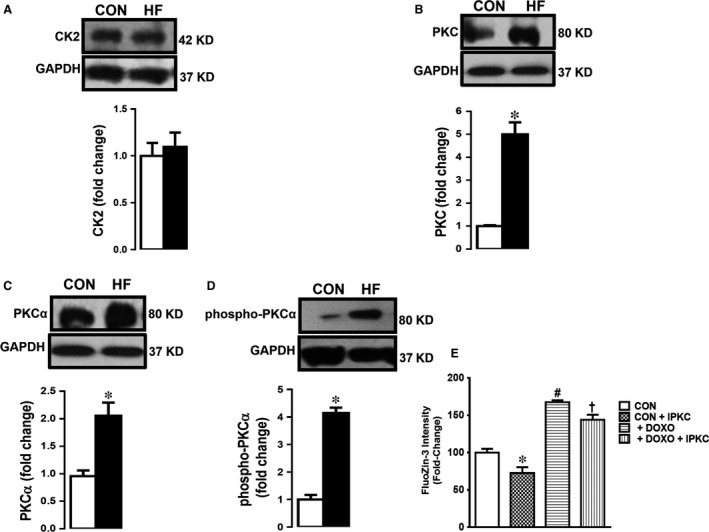
Figure 6.

Endogenous kinases CK2 and PKC in the human heart tissues. The densitometry analysis of the protein expression levels (Western blotting) given as original bands and mean (±S.E.M.) values for CK2 (α1/α2) in (A), total PKC in (B), phospho‐PKCα (right) and PKCα (left) in (C) with respect to GAPDH at 37 kD given for human (HF) and group comparison with the controls. The data were obtained after duplicate assays of each sample from each group for each type of measurement. The number of samples used are the same given in Figure 4 for groups. (D) The [Zn2+]i levels measured in doxorubicin‐treated cells with and without a total PKC inhibitor (IPKC GF109203X; 0.1 μM for 24‐hrs incubation). Bars represent mean (±S.E.M.). Significance level accepted at *P < 0.05 versus CON group, # P < 0.05 versus CON group and † P < 0.05 versus DOXO group.
