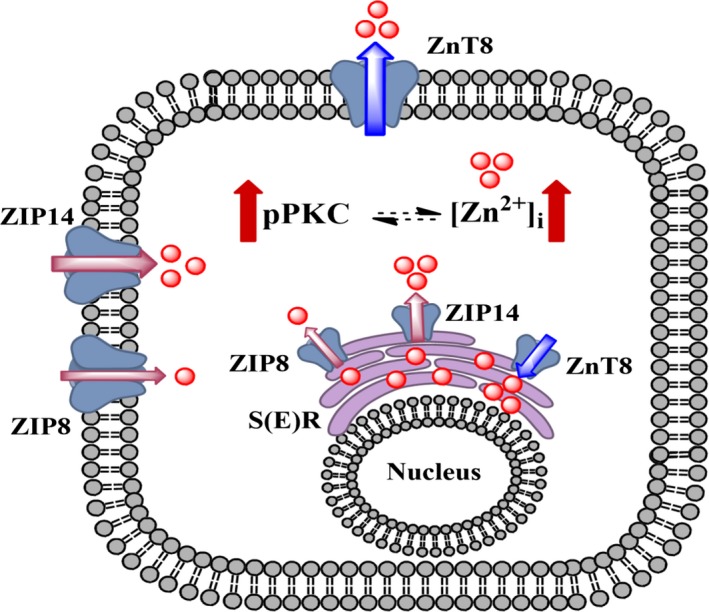
Figure 7.

A putative summarized presentation of our data on a possible role of Zn2+ transporters on an intersection‐pathway associated with increased cytosolic free Zn2+ and PKCα‐activation and induction of heart failure via development of ER stress. The thickness of the arrows related with the transporters show the alterations in their expression levels. Here, thick red arrows represent increased level of pPKC as phosphorylated PKCα and increased [Zn2+]i, intracellular‐free Zn2+ concentration in cells under heart failure. The thickness of red arrows related with localization of Zn2+ transporters represent increase/decrease expression levels. S(E)R represents sarco(endo)plasmic reticulum.
