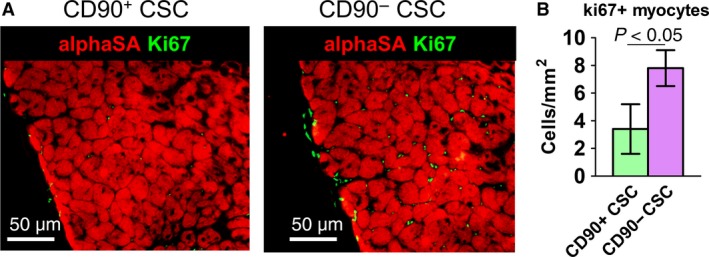
Figure 6.

Proliferation of cardiomyocytes. (A) Representative fluorescent micrographs showing ki67 positive nuclei (green) in the myocardium. (B) Quantitation of ki67 and alpha‐SA double positive cells (n = 3). Scale bar = 50 μm. Two‐tailed t‐test for comparison.
