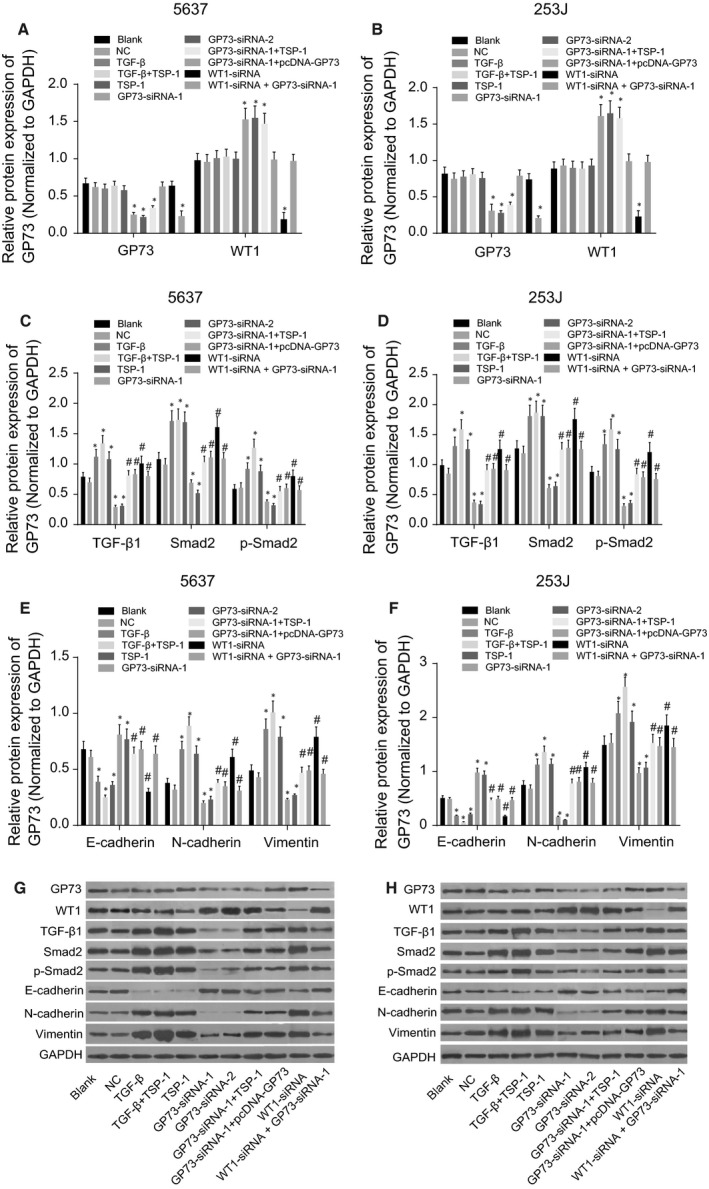
Figure 5.

Protein levels of GP73, WT1, TGF‐β1, Smad2, p‐Smad2, E‐cadherin, N‐cadherin and vimentin in 5637 and 253J cells 48 hrs after transfection. Note: (A) protein levels of GP73 and WT1 in 5637 cells; (B) protein levels of GP73 and WT1 in 253J cells; (C) protein levels of TGF‐β1, Smad2 and p‐Smad2 in 5637 cells; (D) protein levels of TGF‐β1, Smad2 and p‐Smad2 in 253J cells; (E) protein levels of vimentin, N‐cadherin and E‐cadherin in 5637 cells; (F), protein levels of vimentin, N‐cadherin and E‐cadherin in 253J cells; (G), protein band pattern of 5637 cells; (H), protein band pattern of 253J cells; *, P < 0.05, compared with the blank and NC groups; #, P < 0.05, compared with the GP73‐siRNA‐1 group; NC, negative control; TSP‐1, thrombospondin‐1; GP73, Golgi membrane protein 73; WT1, Wilms' tumour gene 1; TGF‐β1, transforming growth factor‐β1.
