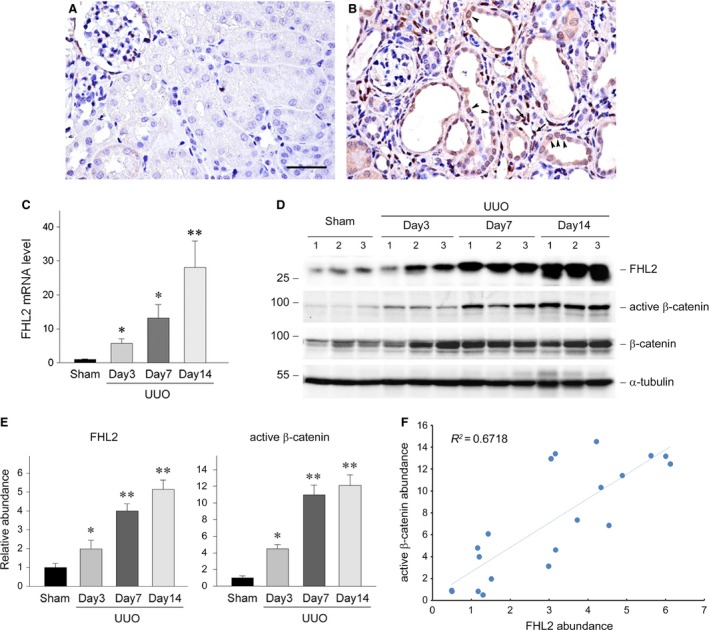
Figure 8.

Renal β‐catenin activity is closely correlated with FHL2 induction in a mouse model of obstructive nephropathy. (A and B) Representative micrographs display the induction and localization of FHL2 in fibrotic kidney. Kidneys from sham (A) and UUO for 7 days (B) were stained immunohistochemically for FHL2 protein. Bar = 40 μm. Arrowheads and arrows indicate FHL2‐positive tubular epithelial cells and FHL2‐positive cells in the interstitium, respectively. (C) Quantitative real‐time RT‐PCR data on renal FHL2 mRNA level in different groups of mice as indicated. *P < 0.05, **P < 0.01 versus sham controls (n = 4). (D and E) Representative Western blot analyses (D) and quantitative data (E) show the induction of renal FHL2 protein and the activation of β‐catenin at different time‐points after UUO. Numbers (1, 2 and 3) in D indicate each individual animal in a given group. *P < 0.05, **P < 0.001 versus sham controls (n = 5). (F) Linear regression shows a close correlation between renal active β‐catenin abundance and FHL2 abundance (arbitrary units). The correlation coefficient (R 2) is shown.
