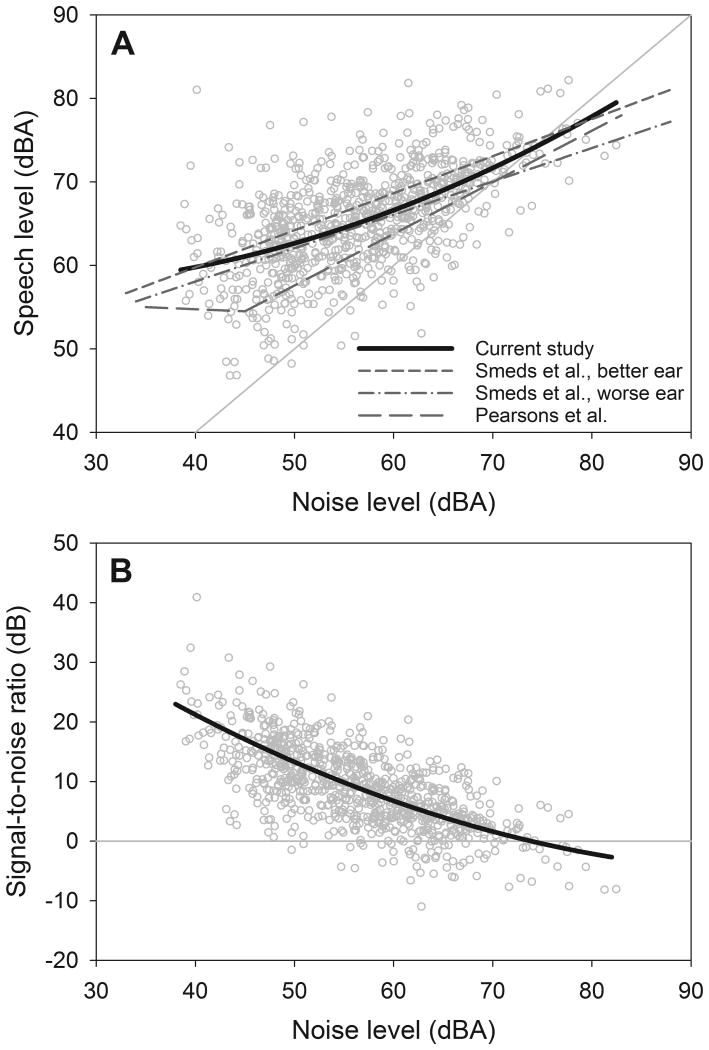
Figure 3.
3A. Speech level as a function of noise level reported in the current study (circles and thick black solid curve), Smeds et al. (2015), and Pearsons et al. (1977). Chest-level microphones were used in the current study while ear-level microphones were used in Smeds et al., and Pearson et al. Diagonal light gray line represents where the speech level is equal to the noise level. 3B. Signal-to-noise ratio as a function of noise level reported in the current study.

