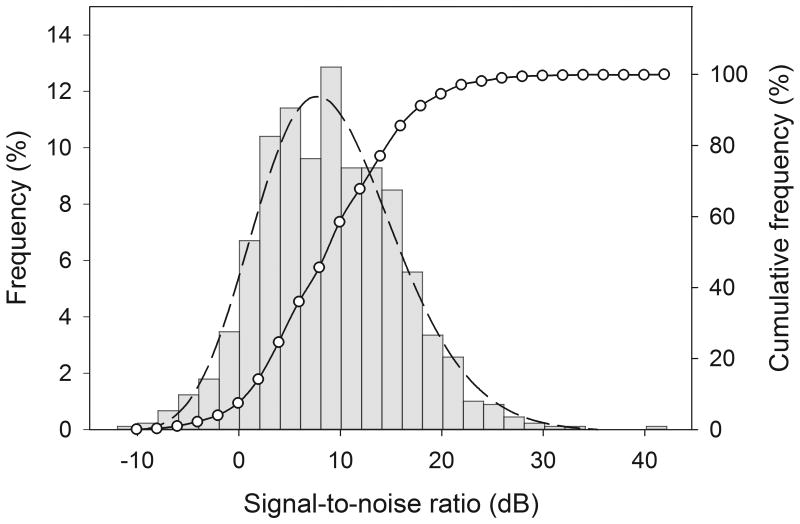
Figure 4.
Distribution of signal-to-noise ratios (SNRs) measured using chest-level microphone. Gray bars represent a histogram (refer to the left y-axis). Dashed curve (refer to the left y-axis) represents an asymmetric peak function that fits the histogram data of occurrence frequency and bin center value. Open circles represent the frequency of occurrence of the SNRs that are lower than a given SNR (i.e., the cumulative frequency; refer to the right y-axis).

