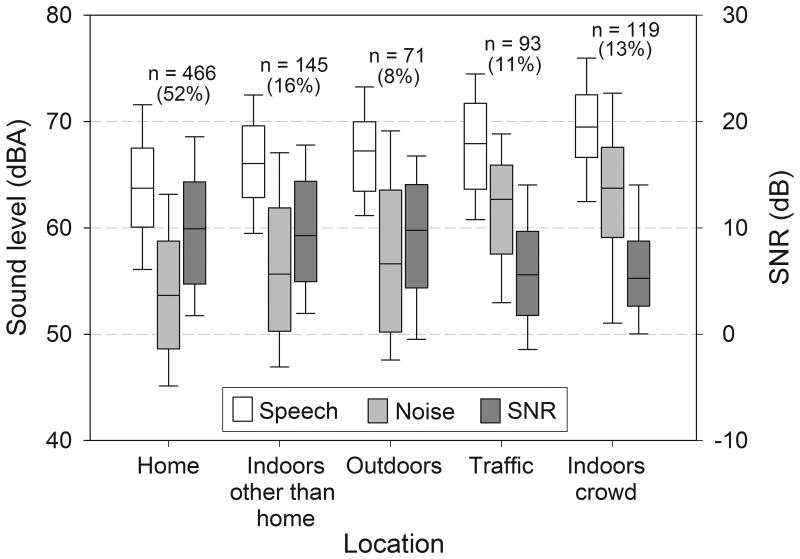
Figure 5.
Boxplots of speech level, noise level (refer to the left y-axis), and signal-to-noise ratio (SNR; refer to the right y-axis) as a function of self-reported listening environment. The boundaries of the boxes represent the 25th and 75th percentile and the line within the boxes marks the median. Error bars indicate the 10th and 90th percentiles.

