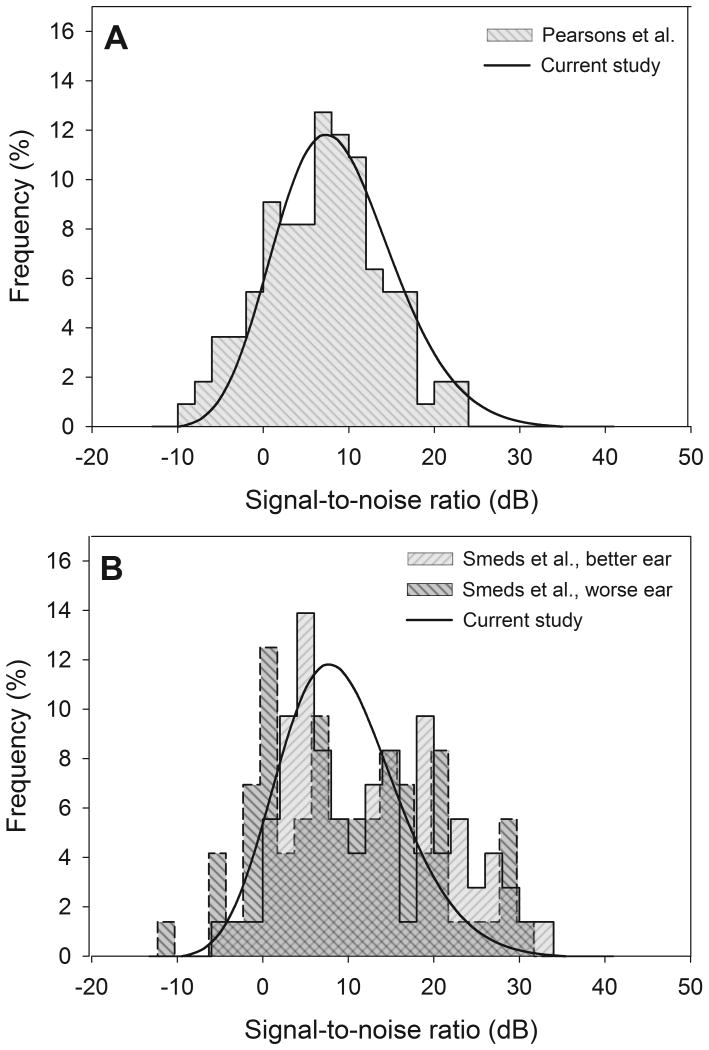
Figure 7.
Signal-to-noise ratio (SNR) distribution curve of the current study and histograms of SNRs reported by Pearsons et al. (1977) (7A) and Smeds et al. (2015) (7B). The light gray shade and dark gray shade in Figure 7B represent the histograms of the better SNR ear and worse SNR ear, respectively. Chest-level microphones were used in the current study while ear-level microphones were used in Smeds et al., and Pearson et al.

