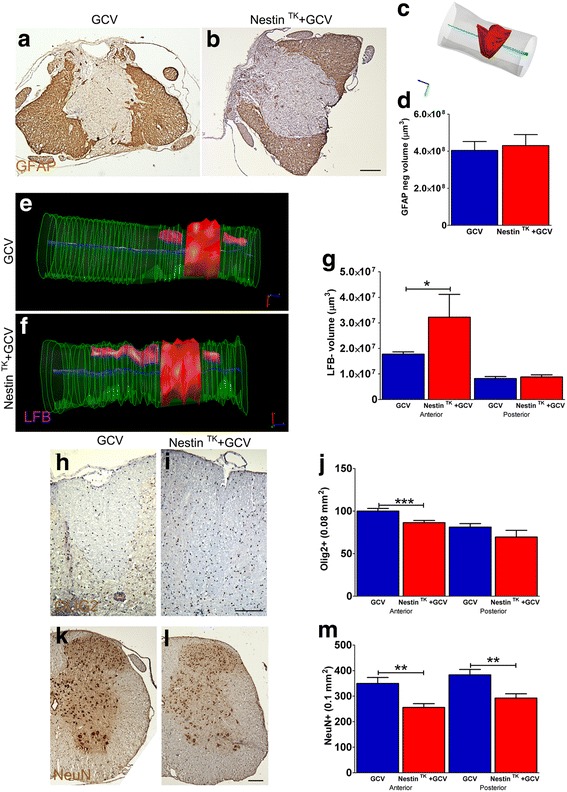
Fig. 4.

GCV-NestinTK mice show enhanced tissue damage after SCI. a–d Stereological quantification of the lesion volume as GFAP− tissue injury in GCV-NestinTK and GCV-WT mice. a, b Representative axial images of GFAP-labeled sections from GCV-WT (a) and GCV-NestinTK (b) mice. In the 3D rendering c, the solid light blue is the central canal and the solid red is the volume negative for GFAP. Quantifications (means ± S.E.M.) are shown in d (n = 5–8 per group). e–g Stereological quantification of demyelination by Luxol fast blue (LFB) in GCV-NestinTK and GCV-WT mice, (e, f violet solid, n = 4–5 per group). Quantifications of the demyelination volumes (means ± S.E.M.) are shown in g, *p = 0.023. h–i Olig2+ p = 0.0005. k–l, NeuN+ cells (**p = 0.0058 anterior and **p = 0.0052 posterior) by immunohistochemistry in GCV-NestinTK and GCV-7WT mice. Quantifications (means ± S.E.M., n = 3 per group), performed and day 31, are provided in j, m. One-way ANOVA followed by Bonferroni’s multiple comparison test has been used to analyze data of g, j, and m. Scale bar 100 μm
