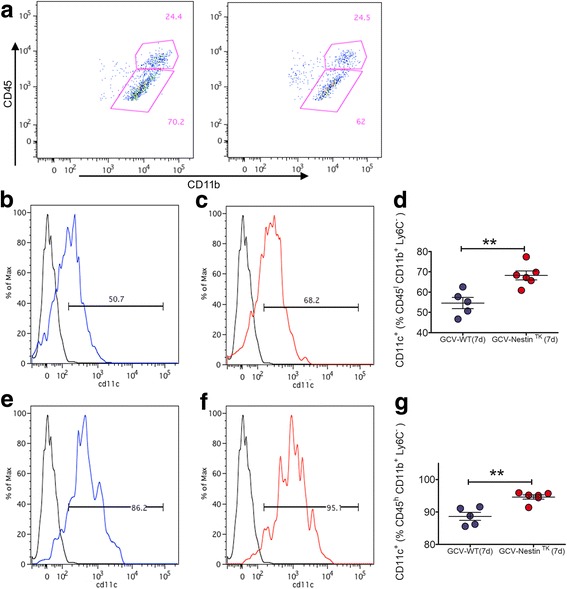
Fig. 7.

CD11c is increased in microglia of GCV-NestinTK mice. Representative dot plots showing the gating strategy for the identification of CD45high and CD45Int also expressing CD11b, gated on the CD45+ Ly6C− cells (a). Quantifications of the expression level CD11c on CD45ICD11d+Ly6C−cells (b-c) and CD11c on CD45hCD11d+Ly6C− cells (e-g). For all quantifications red dots are GCV-NestinTK mice while blue dots are GCV-WT mice, each dot represents a single animal. Unpaired t test, ** p < 0.01
