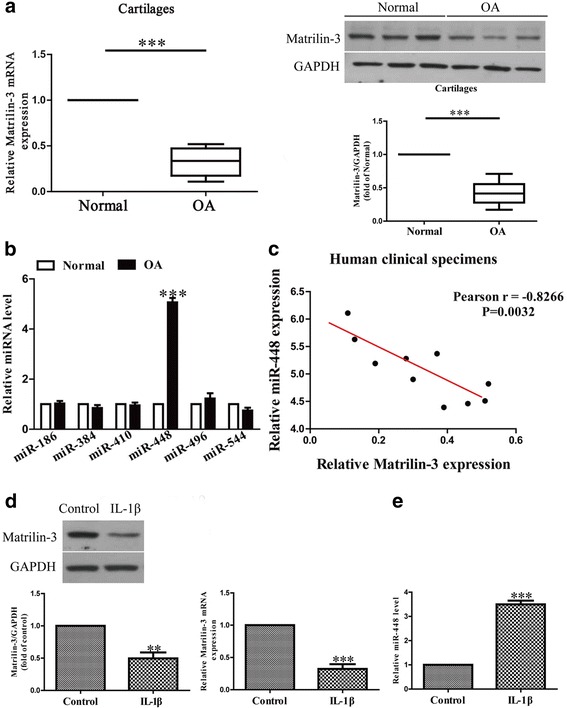
Fig. 1.

The levels of matrilin-3 and miR-448 in osteoarthritis cartilage and IL-1β-induced chondrocytes. a The mRNA and protein levels of matrilin-3 in normal and osteoarthritis cartilages were determined using quantitative real-time PCR and western blot, n = 10. b The levels of miR-186, miR-384, miR-410, miR-448, miR-496 and miR-544 in osteoarthritis cartilages were determined using quantitative real-time PCR, n = 10. c Pearson’s correlation analysis of the relative expression levels of miR-448 and the relative matrilin-3 mRNA levels in osteoarthritis cartilage. d Chondrocytes were treated with 5 ng/ml IL-1β for 24 h. The expression of matrilin-3 was analyzed using quantitative real-time PCR and western blot, and normalized to GAPDH, n = 4. e The level of miR-448 was analyzed using quantitative real-time PCR and normalized to U6, n = 4. The data shown are means ± SEM. OA: chondrocytes from patients with osteoarthritis. Normal: chondrocytes from patients without osteoarthritis. ***p < 0.001 vs. normal or control
