Fig. 7.

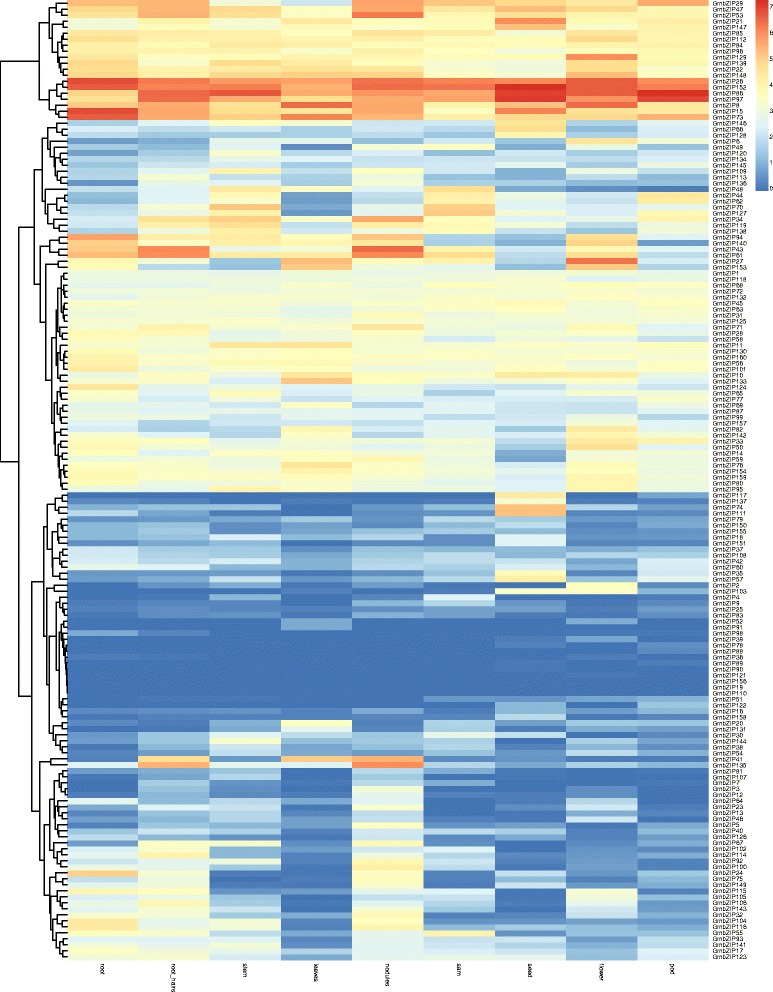
Expression profiles of 160 GmbZIP genes in 9 different tissues of soybean. Different colors in map represent gene transcript abundance values as shown in bar at top of figure

Expression profiles of 160 GmbZIP genes in 9 different tissues of soybean. Different colors in map represent gene transcript abundance values as shown in bar at top of figure