Fig. 8.

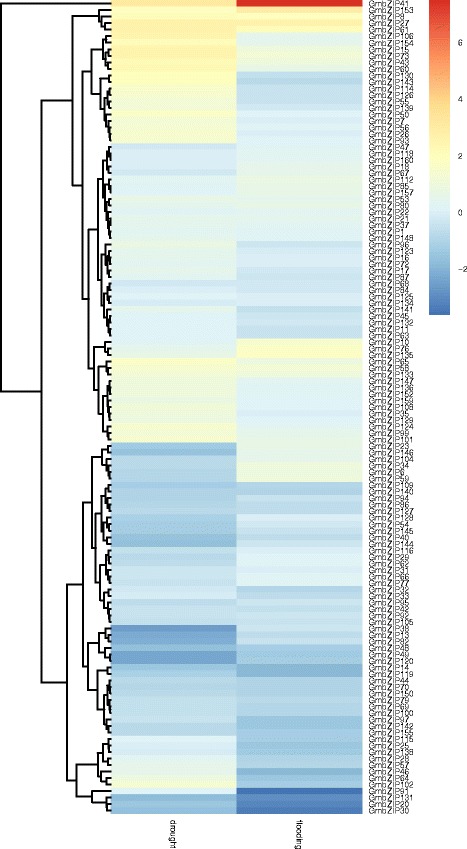
Heat map showing GmbZIP expression patterns in soybean under drought and flooding stress. Different colors in map represent gene transcript abundance values after dividing wild type as shown in bar at top of figure

Heat map showing GmbZIP expression patterns in soybean under drought and flooding stress. Different colors in map represent gene transcript abundance values after dividing wild type as shown in bar at top of figure