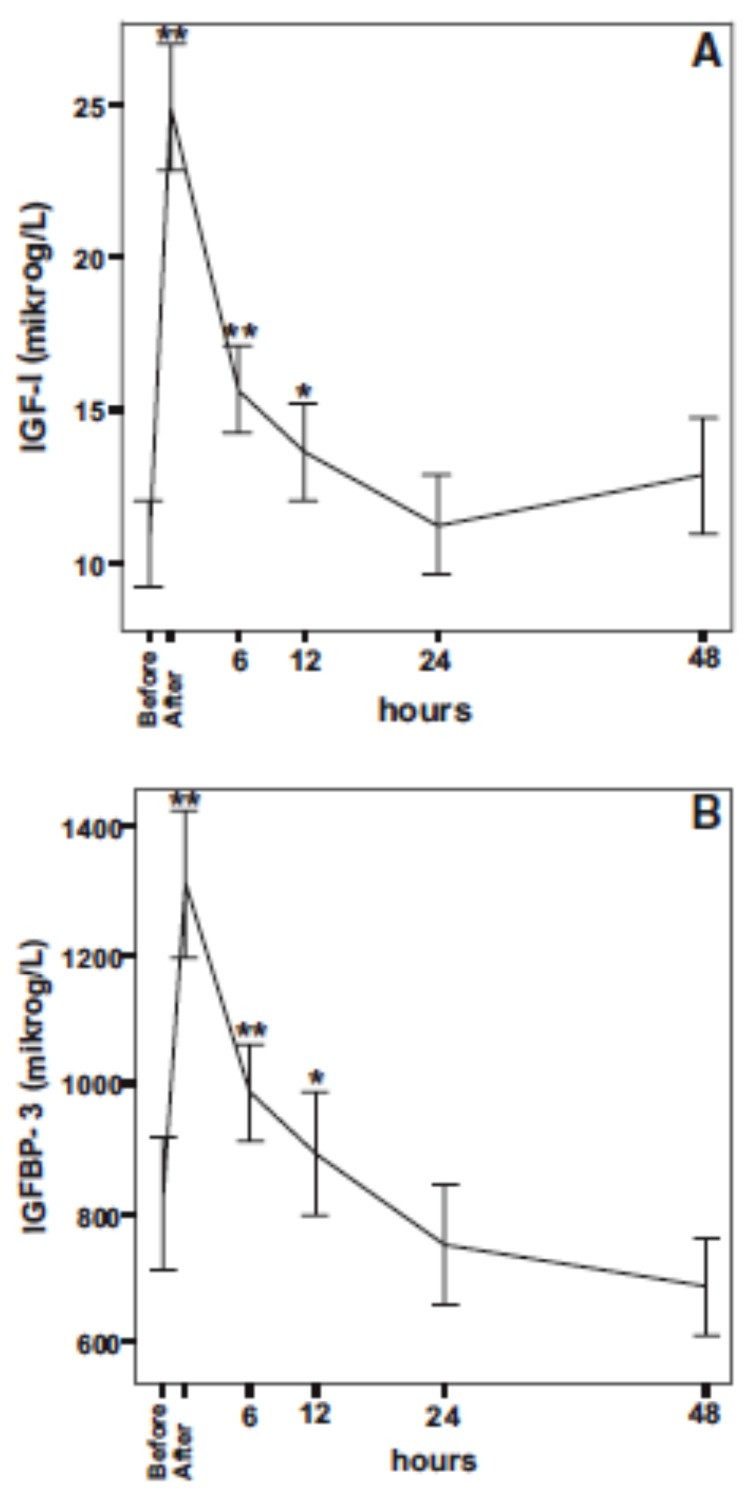
Fig. (3).
Mean concentrations of IGF-I (A) and IGFBP-3 (B) before (n=20) and at 6 (n=19), 12 (n=19), 24 (n=16) and 48h (n=14) after FFP. Error bars show ±1 SEM. *, P<0.05 and **, P<0.01 denote significant differences compared with levels before transfusion of FFP. Copyright ©JCEM, reproduced with permission.

