Fig. 1.

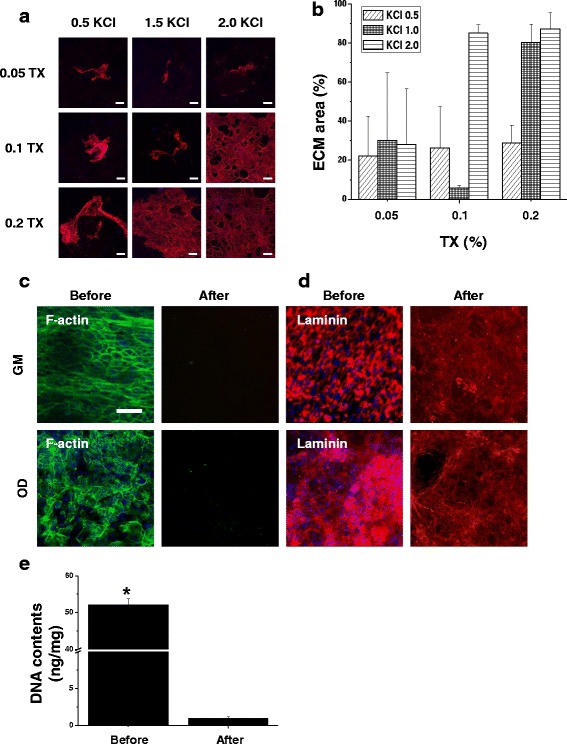
Confirmation and characterization of decellularized ECM. a Representative images of immunofluorescent staining with anti-laminin after decellularization with various concentrations of D-solutions. The scale bars represent 100 μm. b Quantification of remaining laminin after decellularization with various concentrations. c Representative images of immunofluorescent staining under GM and OD with anti-f-actin and (d) laminin before and after decellularization. The concentration of D-solution was KCl of 2.0 M and Triton X-100 of 0.2%. The scale bars represent 100 μm. e Quantification analysis of amount of residual DNA contents before and after decellularization. *p < 0.05 compared to after decellularization group
