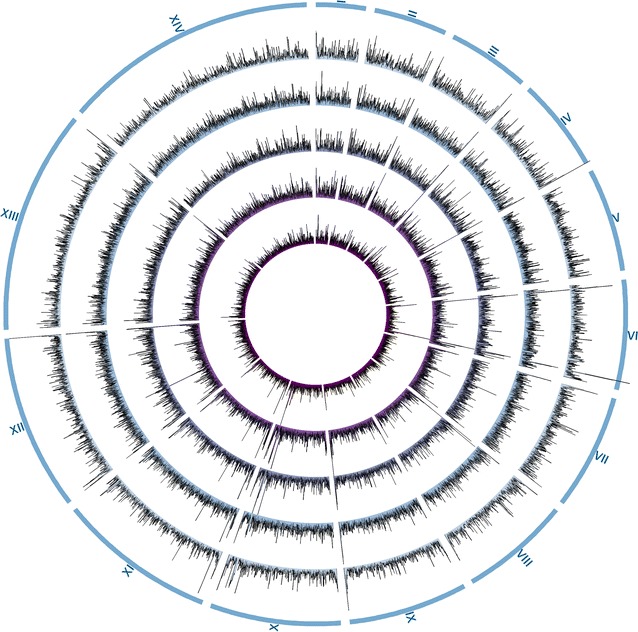
Fig. 2.

Read distribution across reference genome. From outermost ring: 3D7 reference genome chromosomes 1–14 (number written in roman letters, chromosomes illustrated to scale). Histograms representing read depths averaged over 2000 bp for sample 5, sample 4, sample 3, sample 2 and sample 1 (such that parasitaemia decreases from outer to inner most ring). The image was produced using the Circos software (see “Methods”) [22]
