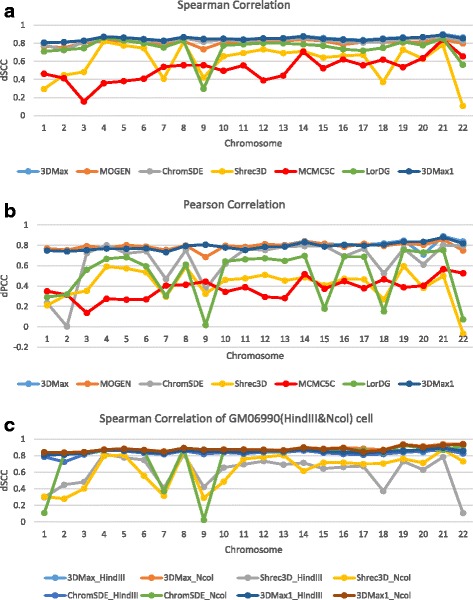
Fig. 5.

A comparison of the accuracy of different methods on real Hi-C datasets. a The Spearman Correlation Coefficient of 3DMax, 3DMax1, MOGEN, ChromSDE, ShRec3D, MCMC5C, and LorDG on the normalized contact maps of GM06990_HindIII cell. b The Pearson Correlation Coefficient of 3DMax, 3DMax1, MOGEN, ChromSDE, ShRec3D, MCMC5C, and LorDG on the normalized contact maps of GM06990_HindIII cell. c The Comparison of 3DMax, 3DMax1, ChromSDE and ShRec3D on the normalized contact maps of GM06990 HindIII and Ncol cell. Y-axis denotes either the distance Spearman correlation coefficient (dSCC) score in the range [− 1,1] or the distance Pearson correlation coefficient score (dPCC) in the range [− 1,1]. X-axis denotes the Chromosome number. A higher dSCC value means the better accuracy
